DOT HS 811 718 April 2013
The 2011 National Survey of the
Use of Booster Seats
DISCLAIMER
This publication is distributed by the U.S. Department of Transportation, National Highway
Trafc Safety Administration, in the interest of information exchange. The opinions, ndings,
and conclusions expressed in this publication are those of the authors and not necessarily those
of the Department of Transportation or the National Highway Trafc Safety Administration.
The United States Government assumes no liability for its contents or use thereof. If trade names,
manufacturers’ names, or specic products are mentioned, it is because they are considered essential
to the object of the publication and should not be construed as an endorsement. The United States
Government does not endorse products or manufacturers.
Suggested APA Format Citation:
Pickrell, T. M., & Ye, T. J. (2013, April). The 2011 National Survey of the Use of Booster
Seats. (Report No. DOT HS 811 718). Washington, DC: National Highway Trafc Safety
Administration.
i
Technical Report Documentation Page
1. Report No.
DOT HS 811 718
2. Government Accession No.
3. Recipient's Catalog No.
4.
Title and Subtitle
The 2011 National Survey of the Use of Booster Seats
5. Report Date
April 2013
6. Performing Organization Code
NVS-421
7. Author(s)
Timothy M. Pickrell
* †
and Tony Jianqiang Ye
8. Performing Organization Report No.
9. Performing Organization Name
Mathematical Analysis Division, National Center for Statistics and Analysis
National Highway Traffic Safety Administration
U.S. Department of Transportation, NVS-421
1200 New Jersey Avenue SE.
Washington, D.C. 20590
10. Work Unit No. (TRAIS)
11. Contract or Grant No.
12. Sponsoring Agency Name and Address
Mathematical Analysis Division, National Center for Statistics and Analysis
National Highway Traffic Safety Administration
U.S. Department of Transportation, NVS-421
1200 New Jersey Avenue SE.
Washington, D.C. 20590
13. Type of Report and Period Covered
NHTSA Technical Report
14. Sponsoring Agency Code
15. Supplementary Notes
* Mathematical Statistician, Mathematical Analysis Division, National Center for Statistics and Analysis, NHTSA
† Mathematical Statistician, Bowhead System Management Inc., contractor working at NHTSA
Abstract
This technical report presents results from the 2011 National Survey of the Use of Booster Seats (NSUBS). NSUBS is the only
probability-based nationwide child restraint use survey in the United States that observes restraint use and interviews adult
occupants to collect race, ethnicity and other data. NHTSA’s National Center for Statistics and Analysis conducts the NSUBS.
The 2011 NSUBS found that 47 percent of 4- to 7-year-old children were restrained in booster seats in 2011 as compared to 41
percent in 2009. Restraint use for all children under 13 increased to 91 percent in 2011. Although there were some indications
of premature graduation to restraint types that are not appropriate for children’s age, height, and weight, we see significant
improvements in use of appropriate restraint types among children of various categories in 2011 as compared to 2009.
17. Key Words
Booster seats, child restraints, child safety, car seats, seat
belt use, race, ethnicity, occupant protection, Hispanic,
premature graduation
18. Distribution Statement
Document is available to the public from the National Technical
Information Service www.ntis.gov
19. Security Classif.
Unclassified
(of this report) 20. Security Classif.
Unclassified
(of this page) 21. No. of
44
Pages 22. Price
Form DOT F 1700.7 (8-72) Reproduction of completed page authorized
ii
Executive Summary
This report presents results from the 2011 National Survey of the Use of Booster Seats
(NSUBS). NSUBS is the only probability-based nationwide child restraint use survey in the
United States that observes restraint use and interviews adult occupants to collect data such as
the race and ethnicity of all occupants in the vehicles. NHTSA’s National Center for Statistics
and Analysis conducts the NSUBS.
In 2000, Congress passed the Transportation Recall Enhancement, Accountability, and
Documentation (TREAD) Act that directed the Department of Transportation to reduce by 25
percent the fatalities and injuries among 4- to 7-year-olds caused by the failure to use booster
seats. In response, NHTSA began the NSUBS survey in 2006 to provide a national estimate of
booster seat use in order to target its outreach programs. The year 2011 is the fifth year for the
NSUBS.
The primary purpose of NSUBS is to estimate booster seat use among 4- to 7-year-old children.
In addition, the survey provides restraint use estimates for all children under 13, race and
ethnicity breakouts of restraint use among all occupants in vehicles, and estimates of the extent
to which children are “prematurely graduated” to restraint types that are inappropriate for their
age as well as height and weight.
The following are some major findings from the 2011 NSUBS:
• Booster seat use among 4- to 7-year-old children increased to 47 percent in 2011 from 41
percent in 2009. This change is not statistically significant.
• The appropriate restraint system for 4- to 7-year-old children is either a forward-facing
car seat or a booster seat, depending on the child’s height and weight. However, the
NSUBS found that 35 percent of children 4 to 7 years old in the United States were not
being properly protected – 25 percent were restrained by seat belts and 10 percent were
unrestrained.
• There continue to be indications of premature graduation to restraint types that are not
appropriate for children’s age, height, and weight. However, there was significant
improvement in the use of appropriate restraint types among children of various
categories in 2011 as compared to 2009. Overall, more children were restrained in car
seats and fewer in seat belts.
o About 7 percent of children 1 to 3 years old were restrained in rear-facing car seats in
2011, a significant increase from 3 percent in 2009.
o Only 2 percent of children 1 to 3 years old were prematurely graduated to seat belts in
2011, a significant decrease from 4 percent in 2009.
o About 18 percent of children 4 to 7 years old were restrained in forward-facing car seats
in 2011, a significant increase from 14 percent in 2009.
o About 25 percent of children 4 to 7 years old were prematurely graduated to seat belts in
2011, a significant decrease from 32 percent in 2009.
o Booster seat use among children from birth to 12 years old who were 37 to 53 inches tall
increased significantly from 32 percent in 2009 to 38 percent in 2011; meanwhile, seat
belt use decreased significantly from 39 percent in 2009 to 33 percent in 2011.
o Booster seat use among children from birth to 12 years old who were 54 to 56 inches tall
increased significantly from 6 percent in 2009 to 13 percent in 2011; meanwhile, seat belt
use decreased significantly from 78 percent in 2009 to 72 percent in 2011.
iii
• Restraint use for all children under 13 years of age increased to 91 percent in 2011; the
restraint use rates for children from birth to 12 months old, 1 to 3 years old, 4 to 7 years
old, and 8 to 12 years old in 2011 were 98 percent, 96 percent, 90 percent, and 88 percent
respectively.
• Restraint use among Non-Hispanic Asian children 8 to 12 years old increased
significantly to 96 percent in 2011 from 80 percent in 2009.
• Restraint use by Hispanics was significantly lower than Non-Hispanics among children
from birth to 12 years old.
• A statistically significant lower seat belt use was continued for Hispanics, and for non-
Hispanic Black or African Americans, than other race and ethnicity groups among
passenger vehicle occupants 25 to 69 years old traveling with children.
• A statistically significant higher seat belt use was continued for non-Hispanic Asians, and
for non-Hispanic Whites, than other race and ethnicity groups among passenger vehicle
occupants 25 to 69 years old traveling with children.

iv
Table of Contents
1. Introduction ............................................................................................................................... 7
2. The National Estimates of Booster Seat Use ............................................................................. 8
Who Should Be in Booster Seats? ........................................................................................... 8
The National Estimates ............................................................................................................ 8
3. Premature Graduation .............................................................................................................. 13
Premature Graduation Among Children Younger Than 1 Year Old ...................................... 13
Premature Graduation Among Children 1 to 3 Years Old ..................................................... 14
Premature Graduation Among Children 4 to 7 Years Old ..................................................... 14
Premature Graduation Among Children 8 to 12 Years Old ................................................... 15
Premature Graduation Based on Weight and Height ............................................................. 16
4. Demographic Results .............................................................................................................. 23
Age ......................................................................................................................................... 23
Race and Ethnicity ................................................................................................................. 23
Gender .................................................................................................................................... 25
5. Occupants Traveling With Children ........................................................................................ 30
6. NSUBS Methodology .............................................................................................................. 34
Sample Design ....................................................................................................................... 34
Sample Size ............................................................................................................................ 34
Data Collection ...................................................................................................................... 35
Estimation .............................................................................................................................. 36
7. References ............................................................................................................................... 37
Appendix: Definitions and Categories in NSUBS ................................................................................ 39

v
List of Figures
Figure 1: Booster Seat Use, National Estimates ........................................................................................... 8
Figure 2: Restraint Use for Children 4 to 7 Years Old ................................................................................. 9
Figure 3: Restraint Use for Children 4 and 5 Years Old ............................................................................... 9
Figure 4: Restraint Use for Children 6 and 7 Years Old ............................................................................... 9
Figure 5: Restraint Use for Children Younger Than 1 Year Old ................................................................ 13
Figure 6: Restraint Use for Children 1 to 3 Years Old ............................................................................... 14
Figure 7: Restraint Use for Children 4 to 7 Years Old ............................................................................... 15
Figure 8: Restraint Use for Children 8 to 12 Years Old ............................................................................. 15
Figure 9: Restraint Use for Children Under 20 Pounds .............................................................................. 16
Figure 10: Distribution of Restraint Types for Children From Birth to 12 Years Old Who Were 20-40 Lbs
............................................................................................................................................................ 17
Figure 11: Distribution of Restraint Types in 2011 for Children From Birth to 12 Years Old Who Were
37-56 Inches Tall ................................................................................................................................ 18
Figure 12: Distribution of Restraint Types for Children From Birth to 12 Years Old Who Were 37-53
Inches Tall .......................................................................................................................................... 18
Figure 13: Distribution of Restraint Types for Children From Birth to 12 Years Old Who Were 54-56
Inches Tall .......................................................................................................................................... 19
Figure 14: Child Restraint Use by Age and Year ....................................................................................... 23
Figure 15: Child Restraint Use by Age and Race/Ethnicity in 2011 .......................................................... 24
Figure 16: Child Restraint Use by Age and Hispanic Origin in 2011 ........................................................ 24
Figure 17: Child Restraint Use by Age and Gender in 2011 ...................................................................... 25
Figure 18: Restraint Use by Age and Race/Ethnicity for Occupants Traveling With Children in 2011 .... 31
Figure 19: Restraint Use by Age and Hispanic Origin for Occupants Traveling With Children in 2011... 31

vi
List of Tables
Table 1: Booster Seat Use, by Age, Weight, or Height .............................................................................. 10
Table 2: Distribution of Restraint Types Among Children 4 to 7 Years Old By Sub-age Groups ............. 12
Table 3: The Types of Restraints Used by Children From Birth to 12 Years Old, by Age ........................ 20
Table 4: The Types of Restraints Used by Children From Birth to 12 Years Old, by Weight ................... 21
Table 5: The Types of Restraints Used by Children From Birth to 12 Years Old, by Height .................... 22
Table 6: Restraint Use Among Children From Birth to 12 Months Old ..................................................... 26
Table 7: Restraint Use Among Children 1 to 3 Years Old ......................................................................... 27
Table 8: Restraint Use Among Children 4 to 7 Years Old ......................................................................... 28
Table 9: Restraint Use Among Children 8 to 12 Years Old ....................................................................... 29
Table 10: Restraint Use of Occupants Traveling With Children by Age and Race/Ethnicity .................... 32
Table 11: Sites, Vehicles, Occupants, and Children From Birth to 12 Years Old in NSUBS .................... 35
7
1. Introduction
In 2000, Congress passed the Transportation Recall Enhancement, Accountability, and
Documentation Act (Pub. L. 106-414; November 1, 2000), which directed the Department of
Transportation to develop a five-year strategic plan to reduce by 25 percent fatalities and injuries
among 4- to 7-year-olds caused by failure to use booster seats. Therefore, there was a need for
reliable data on who is not using booster seats in order to direct outreach programs where they
are most needed.
Prior to the NSUBS, research sponsored by NHTSA and several other organizations have
estimated booster seat use in the United States; however, these estimates are not sufficiently
reliable because they use data either from a non-probability sample that may not result in
nationally representative estimates or from telephone interviews that may not result in reliable
estimates.
In 2006, NHTSA conducted the first-ever nationwide probability-based survey of booster seat
use in the United States and collected data based on the observation of children in vehicles. The
NSUBS yields demonstrably representative results on a certain population of children. The
population of children captured by the NSUBS comprises children who are conveyed by
passenger vehicles to gas stations, fast food restaurants, day care centers, or recreation centers.
NTHSA has used the NSUBS data in its outreach programs and campaigns on child passenger
safety in recent years. In 2010, the total number of traffic crash fatalities among children 4 to 7
years old has reduced to 293 as compared to 570 in 2000 (NHTSA, 2012).
The 2011 NSUBS was conducted from July 14 to August 1, 2011. The survey estimates were
computed based on the results of 9,849 children observed in 6,350 vehicles at 405 observation
sites across the country.
The purpose of this report is to present results from the 2011 NSUBS. During the years 2006-
2008, NHTSA presented the results from the survey through three or four Research Notes, each
of which covered one specific topic. Like the NHTSA technical report, “The 2009 National
Survey of the Use of Booster Seats” (Pickrell & Ye, 2010), this report combines the results
contained in the separate research notes into a single technical report. In order to be consistent
with the publications in previous years, sections in this report are arranged to cover similar topics
to those in the Research Notes published from 2006 to 2008.
It should be noted that this report has classified child restraint systems into four general
categories: car seats (with harness strap, including rear-facing and forward-facing), booster seats
(without harness strap, including high-backed and backless), seat belts, and unrestrained. Please
refer to the Appendix for detailed definitions. Unless otherwise indicated, “significant” always
means “statistically significant” in this report. Percentages may not add up to 100 percent due to
rounding in figures and tables of this report.
8
2. The National Estimates of Booster Seat Use
Who Should Be in Booster Seats?
NHTSA’s current car seat recommendation (March 2011) for children 4 to 7 years old is: Keep
your child in a forward-facing car seat with a harness until he or she reaches the top height or
weight limit allowed by your car seat’s manufacturer. Once your child outgrows the forward-
facing car seat with a harness, it’s time to travel in a booster seat, but still in the back seat.
The National Estimates
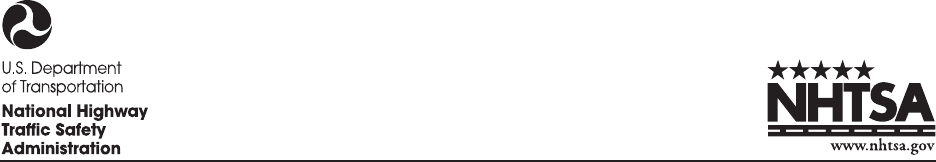
The 2011 NSUBS found that booster seat use among 4- to 7-year-old children increased from 41
percent in 2009 to 47 percent in 2011(Figure 1). This increase is not statistically significant.
Figure 1: Booster Seat Use, National Estimates
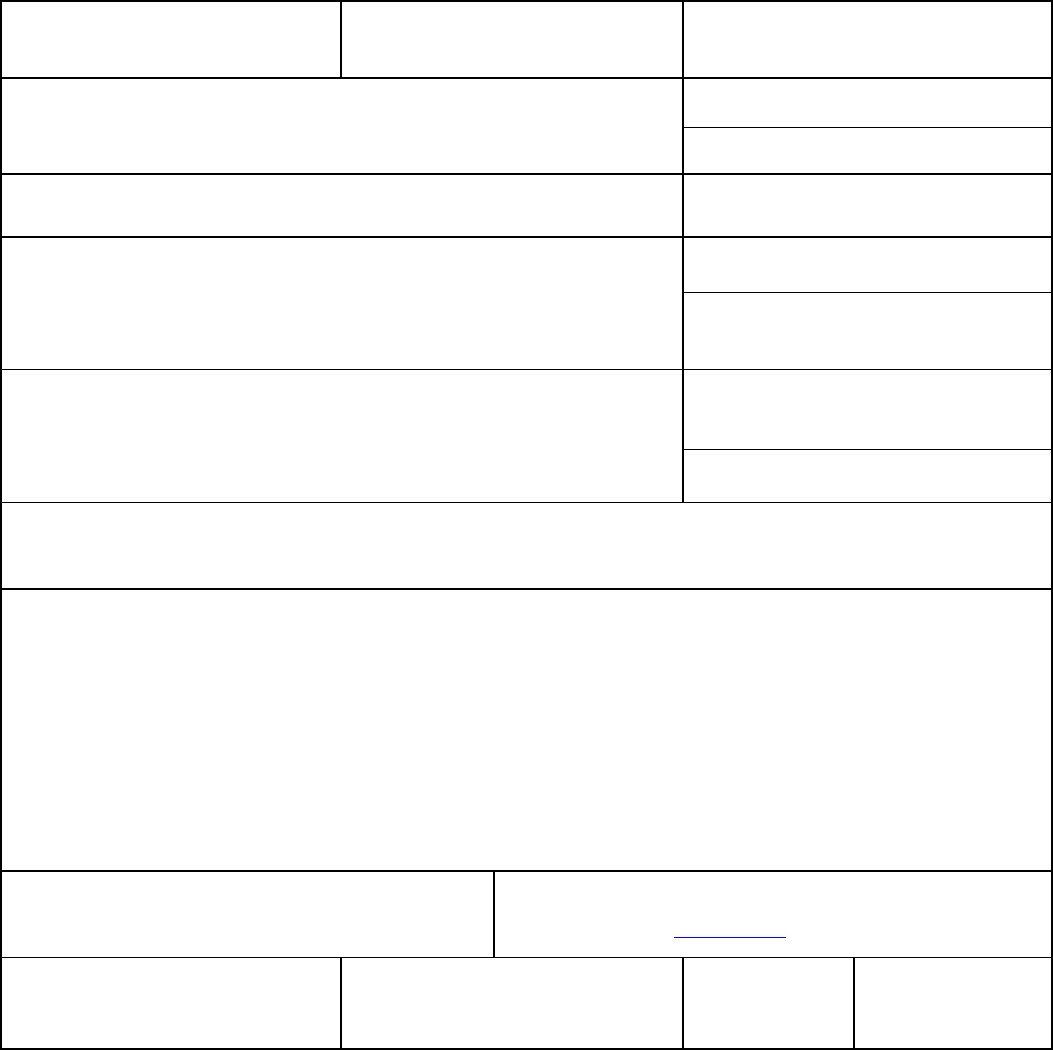
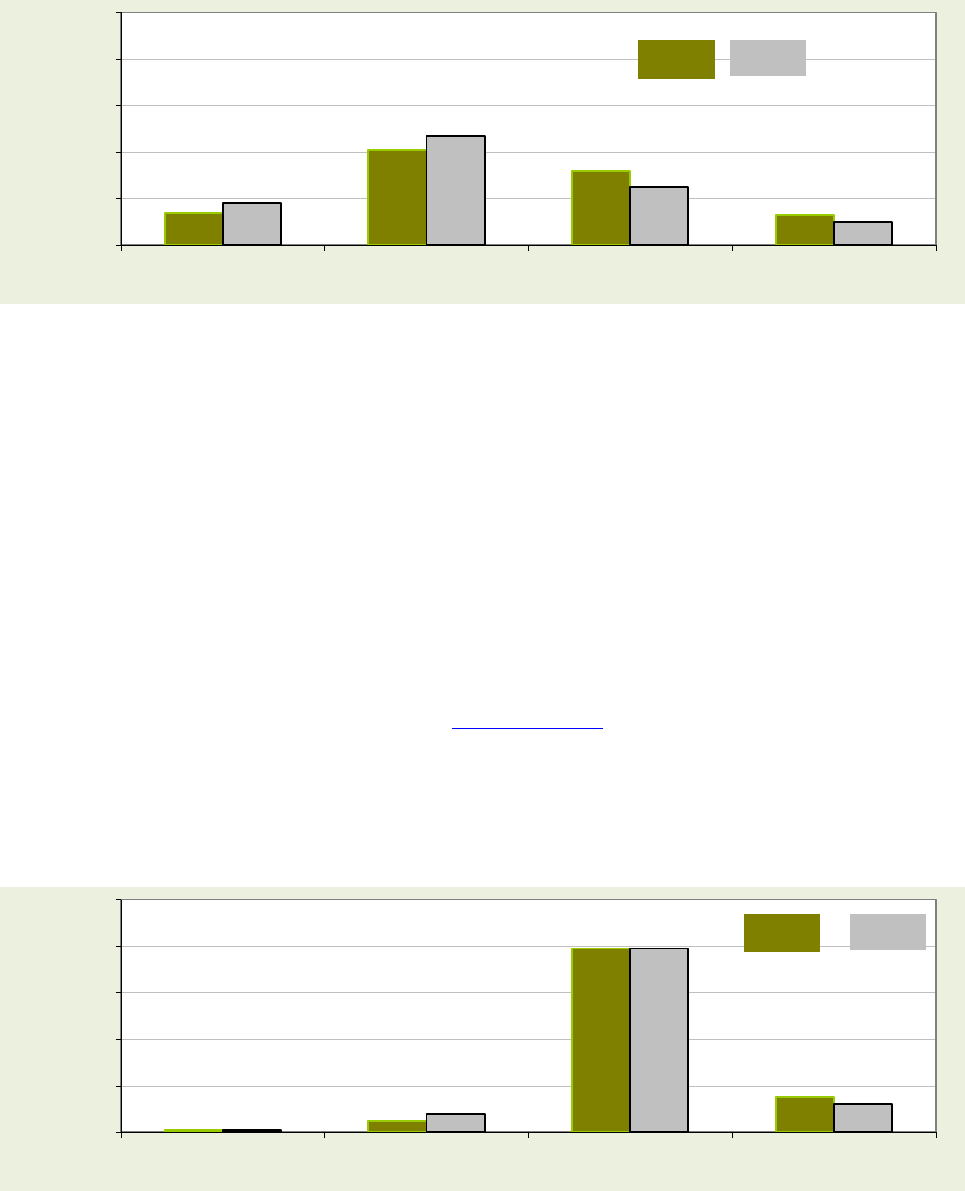
The appropriate restraint system for children age 4 to 7 years is either a forward-facing car seat
or a booster seat, depending on the child’s height and weight. However, the NSUBS found that
in 2011, 47 percent of children in this age group were using booster seats (either high-backed or
backless), 18 percent were restrained in child car seats, 25 percent were in seat belts, and 10
percent were unrestrained (Figure 2). These results indicate that as many as 35 percent (25
percent in seat belts and 10 percent unrestrained) of children 4 to 7 in the United States were not
being properly restrained. However, the percent of children 4 to 7 were restrained in seat belts
decreased from 25 percent in 2009 to 32 percent in 2011, and this 7-percentage-point decrease is
statistically significant.
41%
37%
43%
41%
47%
0%
20%
40%
60%
80%
100%
2006 2007 2008 2009 2010 2011
Booster Seat Use by 4-
7 year -olds
9
14%
41%
32%
13%
18%
47%
25%
10%
0%
20%
40%
60%
80%
100%
Car Seat Booster Seat Seat Belt Unrestrained
Restraint Use, in Percent
2011
2009
Figure 2: Restraint Use for Children 4 to 7 Years Old
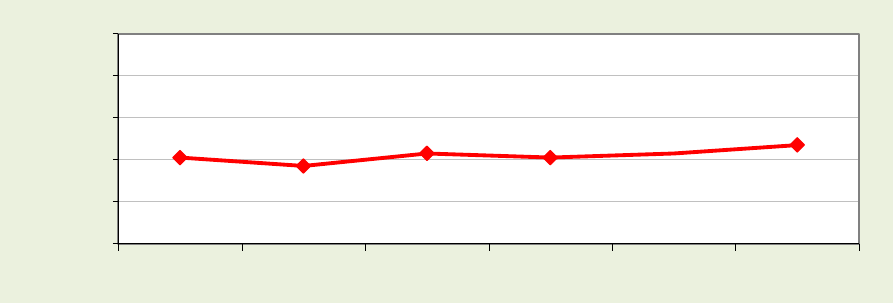
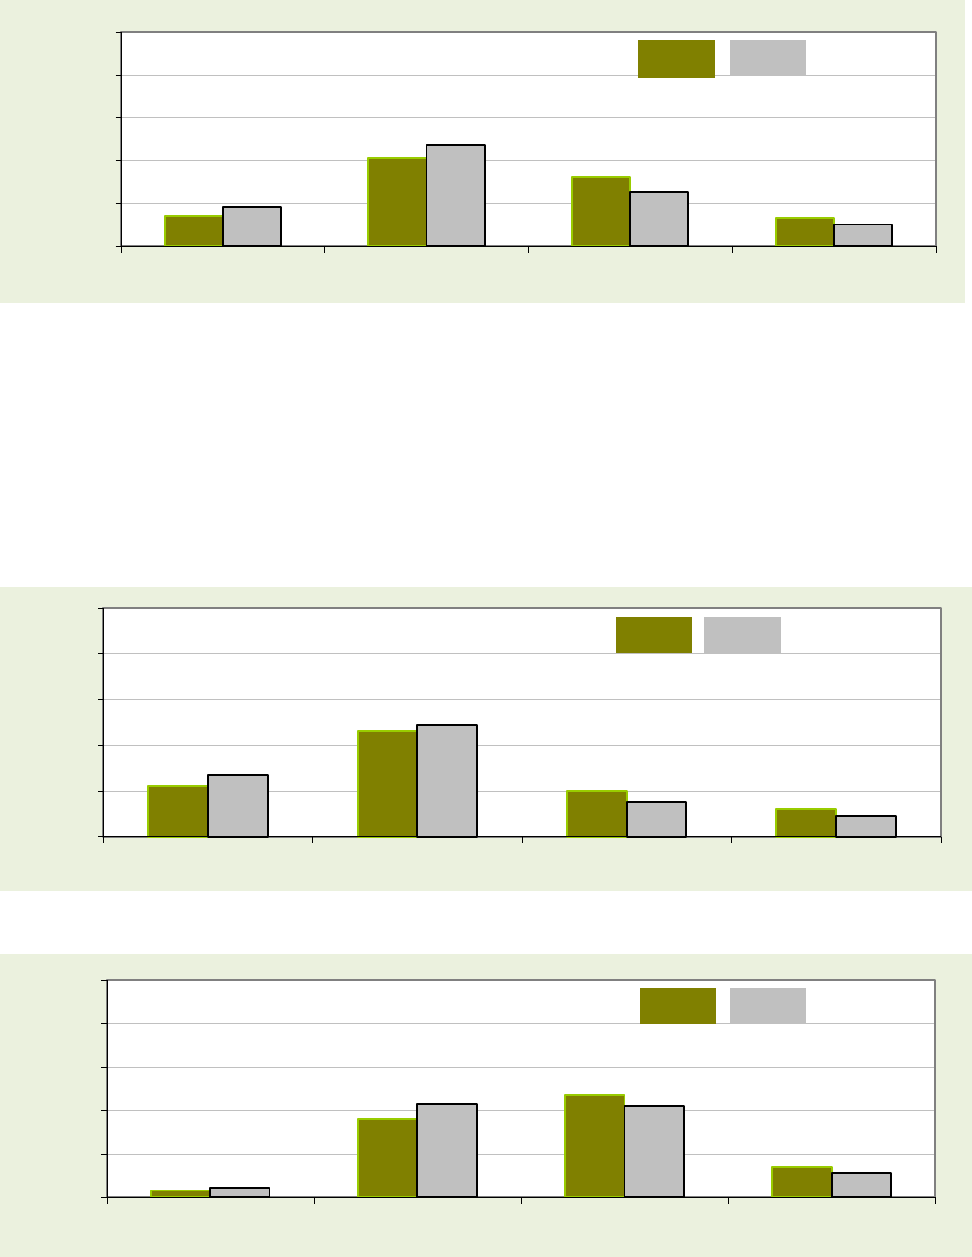
As in 2009, the 2011 NSUBS survey found that among the 4- to 7-year-olds, the younger
children (4- to 5- year olds) had higher booster seat use than the older (6- to 7- year olds)
children. In 2011, 49 percent of children age 4 and 5, as compared to 43 percent of children age 6
and 7, were restrained in booster seats. However, booster seats use among children age 6 and 7
increased significantly from 36 percent in 2009 to 43 percent in 2011. Figure 3 and Figure 4
show the distributions of restraint use for these two sub-age groups, as well as the changes
between 2009 and 2011.
22%
46%
20%
12%
27%
49%
15%
9%
0%
20%
40%
60%
80%
100%
Car Seat Booster Seat Seat Belt Unrestrained
Restraint Use, in Percent
2009 2011
Figure 3: Restraint Use for Children 4 and 5 Years Old
3%
36%
47%
14%
4%
43%
42%
11%
0%
20%
40%
60%
80%
100%
Car Seat Booster Seat Seat Belt Unrestrained
Restraint Use, in Percent
2009 2011
Figu
re 4: Restraint Use for Children 6 and 7 Years Old
10
1
Booster seats are classified into two types: those with seat backs (“high-backed”) and those without (“backless”).
2
Estimates might not sum to totals due to rounding.
3
Survey data are obtained on children from birth to 12 years old in passenger vehicles at a nationwide probability sample of gas
stations, day care centers, recreation centers, and restaurants in five fast food chains. Restraint use is observed by trained data
Table 1: Booster Seat Use, by Age, Weight, or Height
Booster Seat Type
1
2009
2011
2009-2011 Change
Percentage
2
of
Children
3
Using the
Booster Type
Standard
Error
Percentage
2
of
Children
3
Using
the Booster
Type
Standard
Error
Change in
Percentage
Points
Confidence in a
Change in
Percentage
4
Children 1 to 3 Years Old
Booster Seat (Overall)
13%
2%
12%
1%
-1
56%
High-Backed Booster Seat
11%
2%
9%
1%
-2
66%
Backless Booster Seat
3%
0%
3%
0%
0
55%
Children 4 to 7 Years Old
Booster Seat (Overall)
41%
3%
47%
2%
6
84%
High-Backed Booster Seat
24%
3%
25%
1%
1
31%
Backless Booster Seat
17%
2%
21%
1%
4
86%
Children 8 to 12 Years Old
Booster Seat (Overall)
5%
1%
8%
1%
3
99%
High-Backed Booster Seat
2%
1%
3%
0%
1
80%
Backless Booster Seat
3%
0%
5%
0%
2
100%
Children From Birth to 12 Years Old Who Weigh Between 20 and 40 Pounds
Booster Seat (Overall)
22%
4%
20%
1%
-2
38%
High-Backed Booster Seat
16%
4%
14%
1%
-2
39%
Backless Booster Seat
6%
1%
6%
1%
0
6%
Children From Birth to 12 Years Old Who Weigh Between 41 and 60 Pounds
Booster Seat (Overall)
36%
3%
45%
2%
9
100%
High-Backed Booster Seat
18%
2%
22%
1%
4
90%
Backless Booster Seat
17%
2%
23%
1%
6
99%
Children From Birth to 12 Years Old Who Weigh More than 60 Pounds
Booster Seat (Overall)
7%
1%
10%
1%
3
95%
High-Backed Booster Seat
3%
1%
4%
0%
1
45%
Backless Booster Seat
4%
0%
6%
1%
2
100%
Children From Birth to 12 Years Old Who Are At Most 36 Inches Tall
Booster Seat (Overall)
13%
2%
12%
1%
-1
40%
High-Backed Booster Seat
9%
2%
8%
1%
-1
49%
Backless Booster Seat
4%
1%
4%
0%
0
15%
Children From Birth to 12 Years Old Who Are Between 37 and 53 Inches Tall
Booster Seat (Overall)
32%
3%
38%
1%
5
94%
High-Backed Booster Seat
19%
3%
20%
1%
1
33%
Backless Booster Seat
13%
1%
17%
1%
4
99%
Children From Birth to 12 Years Old Who Are Between 54 and 56 Inches Tall
Booster Seat (Overall)
6%
1%
13%
2%
7
100%
High-Backed Booster Seat
2%
0%
5%
1%
3
100%
Backless Booster Seat
4%
1%
8%
1%
4
98%
Children From Birth to 12 Years Old Who Are Taller than 56 Inches
Booster Seat (Overall)
2%
1%
3%
0%
1
80%
High-Backed Booster Seat
1%
0%
1%
0%
1
88%
Backless Booster Seat
1%
1%
1%
0%
0
40%
11
collectors prior to or just as the vehicle comes to a stop, except in the case of observation at fast food drive-through lanes, where
restraint use is observed prior to the vehicle reaching the drive-through window.
4
The degree of statistical confidence that the 2011 use rate is different from the 2009 rate. Confidences that meet or exceed 90
percent are formatted in boldface type.
Note: Booster seat use rates for children from birth to 12 months old and who weigh less than 20 pounds are not provided due to
the insufficient data to produce reliable estimates.
Source: The National Survey of the Use of Booster Seats, NHTSA’s National Center for Statistics and Analysis, 2009, 2011
12
Table 2: Distribution of Restraint Types Among Children 4 to 7 Years Old By Sub-age Groups
Restraint Type
1
2009
2011
2009-2011 Change
Percentage
2
of Children
3
Observed in
the Restraint
Type
Standard
Error
Percentage
2
of Children
3
Observed in
the Restraint
Type
Standard
Error
Change in
Percentage
Points
Confidence
in a Change
in
Percentage
4
Children 4 and 5 Years Old
Rear-Facing Car Seat
NA
NA
NA
NA
NA
NA
Forward-Facing Car Seat
22%
3%
27%
2%
5
86%
Booster Seat (Overall)
46%
4%
49%
3%
3
47%
High-Backed Booster Seat
31%
4%
30%
1%
-1
19%
Backless Booster Seat
15%
2%
19%
2%
4
78%
Seat Belt
20%
1%
15%
2%
-5
100%
No Restraint Observed
12%
4%
9%
2%
-3
44%
Children 6 and 7 Years Old
Rear-Facing Car Seat
NA
NA
NA
NA
NA
NA
Forward-Facing Car Seat
3%
1%
4%
1%
0
20%
Booster Seat (Overall)
36%
4%
43%
2%
8
95%
High-Backed Booster Seat
16%
2%
18%
1%
2
68%
Backless Booster Seat
20%
3%
25%
2%
5
90%
Seat Belt
47%
2%
42%
2%
-5
87%
No Restraint Observed
14%
3%
11%
1%
-3
72%
Children 4 to 7 Years Old
Rear-Facing Car Seat
NA
NA
0%
0%
NA
NA
Forward-Facing Car Seat
14%
2%
18%
1%
4
92%
Booster Seat (Overall)
41%
3%
47%
2%
6
84%
High-Backed Booster Seat
24%
3%
25%
1%
1
31%
Backless Booster Seat
17%
2%
21%
1%
4
86%
Seat Belt
32%
2%
25%
1%
-7
99%
No Restraint Observed
13%
3%
10%
1%
-3
57%
1
Survey data are obtained on children from birth to 12 years old in passenger vehicles at a nationwide probability sample of gas
stations, day care centers, recreation centers, and restaurants in five fast food chains.
2
Estimates might not sum to totals due to rounding.
3
Restraint use is observed by trained data collectors prior to or just as the vehicle comes to a stop, except in the case of
observation at fast food drive-through lanes, where restraint use is observed prior to the vehicle reaching the drive-through
window
4
The degree of statistical confidence that the 2011 use rate is different from the 2009 rate. Confidences that meet or exceed 90
percent are formatted in boldface type.
NA: Data not sufficient to produce a reliable estimate.
Source: The National Survey of the Use of Booster Seats, NHTSA’s National Center for Statistics and Analysis, 2009, 2011
13
3. Premature Graduation
The NSUBS, although its primary purpose is to estimate booster seat use, also provides estimates
of the extent to which children are “prematurely graduated” to restraint types that are
inappropriate for their age and size. In this section, we discuss the phenomenon of premature
graduation by age groups since NHTSA’s current car seat recommendation (March 2011) is
primarily based on age.
With regard to size, NHTSA recommends that parents refer to the specific car seat
manufacturer’s instructions on weight and height limits. Car seats on the market exhibit a wide
variation in height and weight limits. Many height limits range between 36 and 54 inches, and
many weight limits range from 40 to 60 pounds. These limits were considered in discussing the
extent of premature graduation in previous NSUBS publications. For comparison purpose, we
will discuss briefly similar results from the 2011 NSUBS survey.
It should be noted that if a column corresponding to a data series or a data category is missing
from a figure in this section, it means that there are not sufficient data to produce a reliable
estimate for the data category. Also note that sometimes estimates might not sum to totals due to
rounding.
Premature Graduation Among Children Younger Than 1 Year Old
NHTSA recommends: “Your child under age 1 should always ride in a rear-facing car seat.
There are different types of rear-facing car seats: Infant-only seats can only be used rear-facing.
Convertible and 3-in-1 car seats typically have higher height and weight limits for the rear-facing
position, allowing you to keep your child rear-facing for a longer period of time.” (Source:
www.safercar.gov)
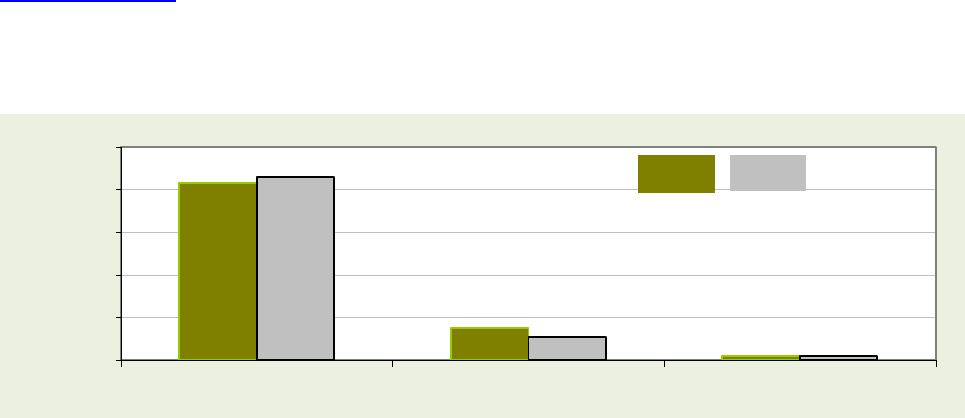
However, as shown in Figure 5, about 14 percent of children under age 1 were not in rear-facing
car seats in 2011. Most of them prematurely graduated to forward-facing car seats.
Figure 5: Restraint Use for Children Younger Than 1 Year Old
83%
15%
2%
86%
11%
2%
0%
20%
40%
60%
80%
100%
Rear-Facing Car Seat Forward-Facing Car Seat Unrestrained
Restraint Use, in Percent
2011
2009
14
Premature Graduation Among Children 1 to 3 Years Old
NHTSA recommends: “Keep your 1 to 3 year old children in rear-facing car seats for as long as
possible. It's the best way to keep them safe. They should remain in a rear-facing car seat until
they reach the top height or weight limit allowed by your car seat's manufacturer. Once outgrown
the rear-facing car seat, they are ready to travel in a forward-facing car seat with a harness.”
(Source: www.nhtsa.gov)
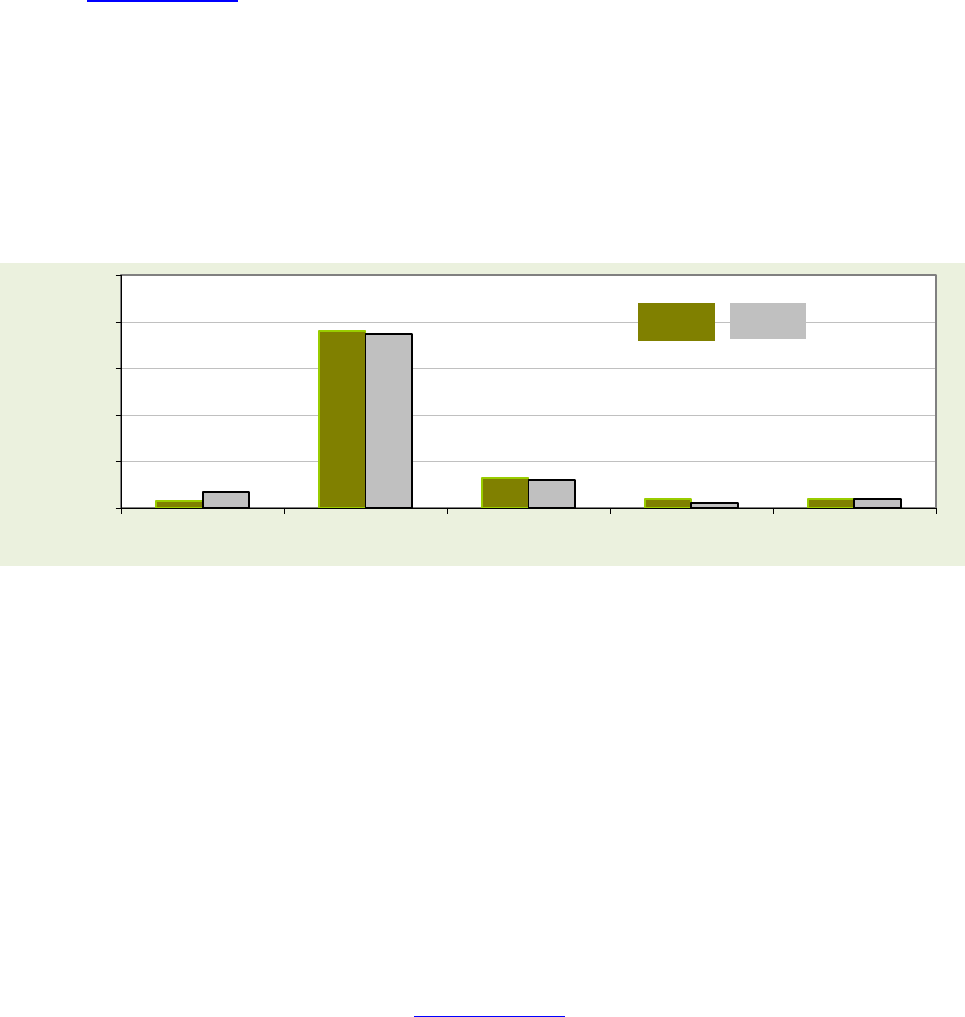
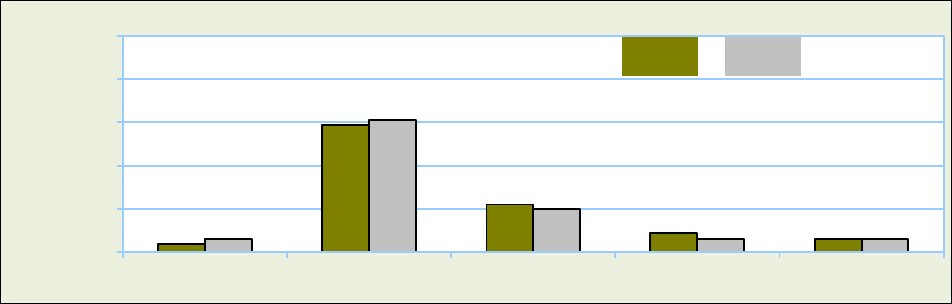
Therefore, the appropriate restraint types for children 1 to 3 years old should be either rear-facing car
seats or forward-facing car seats. However, the 2011 NSUBS found that only 82 percent of children 1 to 3
years old were restrained either in rear-facing car seats (7 percent) or in forward-facing car seats (75
percent) in 2011. About 12 percent of children 1 to 3 years old were prematurely graduated to booster
seats and 2 percent to seat belts. Figure 6 shows the distribution of restraint types for children 1 to 3 years
old in 2009 and 2011.
3%
76%
13%
4% 4%
7%
75%
12%
2%
4%
0%
20%
40%
60%
80%
100%
Rear-Facing Car
Seat
Forward-Facing Car
Seat
Booster Seat Seat Belt Unrestrained
Restraint Use, in Percent
2011
2009
Figure 6: Restraint Use for Children 1 to 3 Years Old
As compared to 2009, there were two improvements for children of this age group as shown in Figure 6:
1) About 7 percent of children were restrained in rear-facing car seats in 2011, a significant increase
from 3 percent in 2009.
2) Only 2 percent of children were prematurely graduated to seat belts in 2011, a significant
decrease from 4 percent in 2009.
Premature Graduation Among Children 4 to 7 Years Old
NHTSA recommends: “Keep your 4 to 7 year old children in forward-facing car seats with a
harness until they reach the top height or weight limit allowed by your car seat's manufacturer.
Once they outgrow their forward-facing car seat with a harness, it's time to travel in a booster
seat ... and still in the back seat”. (Source: www.nhtsa.gov)
Therefore, the appropriate restraint types for children 4 to 7 years old should be either forward-
facing car seats or booster seats. However, the 2011 NSUBS found that only 65 percent of
children 4 to 7 years old was restrained either in forward-facing car seats (18 percent) or in
15
booster seats (47 percent) in 2011. About 25 percent of children 4 to 7 years old were
prematurely graduated to seat belts and 10 percent were unrestrained. Figure 7 shows the
distribution of restraint types for children 4 to 7 years old in 2009 and 2011.
14%
41%
32%
13%
18%
47%
25%
10%
0%
20%
40%
60%
80%
100%
Forward-Facing Car Seat Booster Seat Seat Belt Unrestrained
Restraint Use, in Percent
2011
2009
Figure 7: Restraint Use for Children 4 to 7 Years Old
As compared to 2009, there were also two improvements for children of this age group in 2011 as shown
in Figure 7:
1) About 18 percent of children were restrained in forward-facing car seat in 2011, a significant
increase from 14 percent in 2009.
2) About 25 percent of children were prematurely graduated to seat belt in 2011, a significant
decrease from 32 percent in 2009.
Premature Graduation Among Children 8 to 12 Years Old
NHTSA recommends: “Keep your 8 to 12 year old children in booster seats until they are big
enough to fit in a seat belt properly”. (Source: www.nhtsa.gov
)
However, the 2011 NSUBS found that 12 percent of children ages 8 to 12 years old were unrestrained in
2011. Figure 8 shows the distribution of restraint types for children ages 8 to 12 years old in 2009 and
2011.
1%
5%
79%
15%
1%
8%
79%
12%
0%
20%
40%
60%
80%
100%
Forward-Facing Car Seat Booster Seat Seat Belt Unrestrained
Restraint Use, in Percent
2011
2009
Figure 8: Restraint Use for Children 8 to 12 Years Old
16
As compared to 2009, 8 percent of children age 8 to 12 years old were restrained in a booster seat in
2011, a significant increase from 5 percent in 2009 (Figure 8).
Premature Graduation Based on Weight and Height
NHTSA’s current car seat recommendation (March 2011) for children of all ages are of the following:
• Select a car seat based on your child's age, height, and weight.
• Keep your child in the car seat for as long as possible, as long as your child fits the seat's
height and weight requirements.
• All children under 13 should ride in the back seat.
Although NHTSA does not specify the weight and height recommendations for each age group
as in its old guidelines, it still recommends consulting the manufacturer’s manual for car seat
weight and height limits.
Child car seats on the market exhibit a wide variation in height and weight limits. Height limits
range between 36 and 54 inches, and weight limits range from 40 to 60 pounds. These limits
have been considered in applying NHTSA’s old guidelines to assess the survey results in the
NSUBS publications in previous years. This report will examine of the weight and height
benchmarks specified in NHTSA’s old guidelines for any premature graduation changes in 2011.
Children Weighing Less Than 20 Pounds
According to NHTSA’s current car seat recommendation (March 2011), children under age 1
should be in rear-facing car seats. Since most children under age 1 weigh less than 20 pounds,
NHTSA recommends that these children be restrained in rear-facing car seats.
83%
15%
1%
89%
9%
2%
0%
20%
40%
60%
80%
100%
Rear-Facing Car Seat Forward-Facing Car Seat Unrestrained
Restraint Use, in Percent
2009 2011
Figure 9: Restraint Use for Children Under 20 Pounds
As shown in Figure 9, the 2011 NSUBS found that 11 percent of children less than 20 pounds
were not restrained in rear-facing car seats in 2011 (9 percent prematurely graduated to forward-
facing car seats and 2 percent unrestrained).
However, as compared to 2009, more children under 20 pounds were in rear-facing seats in
2011: the 6-percentage-point increase in use of rear-facing car seats and the 6-percentage-point
17
decrease in use of forward-facing car seats from 2009 to 2011 are both statistically significant
(Figure 9).
Children Weighing 20-40 Pounds
NHTSA recommended that when children outgrow their rear-facing car seats (at a minimum age
1 and at least 20 pounds) they should ride in forward-facing car seats, in the back seat, until they
reach the upper weight or height limit of the particular seat (usually at around age 4 and 40
pounds).
The 2011 NSUBS found that 39 percent of children weighing 20-40 pounds were not in forward-
facing car seats in 2011 (41 percent in 2009) (Figure 10). Note, however, that some 20-40 pound
children could be infants who should be in rear-facing car seats, and note that some booster seats
have weight limits as low as 30 pounds.
4%
59%
22%
9%
6%
6%
61%
20%
6% 6%
0%
20%
40%
60%
80%
100%
Rear-Facing Car Seat Forward-Facing Car Seat Booster Seat Seat Belt Unrestrained
Percent of Children Using the
Restraint Type
2009 2011
Figure 10: Distribution of Restraint Types for Children From Birth to 12 Years Old Who Were 20-40 Lbs
Children Less Than 57 Inches Tall
NHTSA’s old guideline recommended that once children outgrow their forward-facing car seats
(usually at around age 4 and 40 pounds), they should ride in booster seats, in the back seat, until
the vehicle seat belts fit properly. Seat belts fit properly when the lap belt lays across the upper
thighs and the shoulder belt fits across the chest (usually at age 8 or when they are 57 inches
tall).
However, the 2011 NSUBS found that:
• Forty-three percent of children from birth to 12 years old who were 37 to 53 inches tall
were either unrestrained or prematurely graduated to seat belts in 2011 (51 percent in
2009).
• Eighty-five percent of children from birth to 12 years old who were 54 to 56 inches tall
were either unrestrained or prematurely graduated to seat belts in 2011 (93 percent in
2009). However, since 54-56 inches is marginally below NHTSA’s previously-set 57
inch benchmark, it might not be significant as a public safety result.
18
Figure 11 shows many of those children less than 57 inches prematurely graduated to seat belts
in 2011.
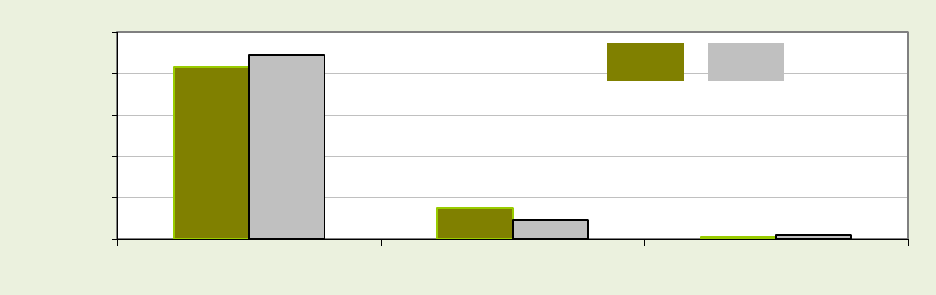
We do see some improvements in 2011 as compared to 2009:
• Booster seat use among children from birth to 12 years old who were 37 to 53 inches tall
increased significantly from 32 percent in 2009 to 38 percent in 2011; meanwhile, seat
belt use decreased significantly from 39 percent in 2009 to 33 percent in 2011. (Figure
12)
• Booster seat use among children from birth to 12 years old who were 54 to 56 inches tall
increased significantly from 6 percent in 2009 to 13 percent in 2011; meanwhile, seat belt
use decreased significantly from 78 percent in 2009 to 72 percent in 2011. (Figure 13)
Figure 12: Distribution of Restraint Types for Children From Birth to 12 Years Old Who Were 37-53
Inches Tall
16%
32%
39%
12%
20%
38%
33%
10%
0%
20%
40%
60%
80%
100%
Car Seat Booster Seat Seat Belt Unrestrained
Percent of Children Using the
Restraint Type
2011
2009
20%
38%
33%
10%
2%
13%
72%
13%
0%
20%
40%
60%
80%
100%
Car Seat Booster Seat Seat Belt Unrestrained
Percent of Children Using the
Restraint Type
37-53 Inches Tall
54-56 Inches Tall
Figure
11: Distribution of Restraint Types in 2011 for Children From Birth to 12 Years Old Who Were 37-56
Inches Tall
19
1%
6%
78%
15%
2%
13%
72%
13%
0%
20%
40%
60%
80%
100%
Car Seat Booster Seat Seat Belt Unrestrained
Percent of Children Using the
Restraint Type
2009 2011
Figure 13: Distribution of Restraint Types for Children From Birth to 12 Years Old Who Were 54-56
Inches Tall
20
Table 3: The Types of Restraints Used by Children From Birth to 12 Years Old, by Age
Restraint Type
1
2009
2011
2009-2011 Change
Percentage
2
of Children
3
Observed
Using the
Restraint
Type
Standard
Error
Percentage
2
of Children
3
Observed
Using the
Restraint
Type
Standard
Error
Change in
Percentage
Points
Confidence
in a Change
in
Percentage
4
Children Less Than 1 Year Old
Rear-Facing Car Seat 83% 4% 86% 2% 3 60%
Forward-Facing Car Seat 15% 3% 11% 2% -4 73%
High-Backed Booster Seat NA NA NA NA NA NA
Backless Booster Seat NA NA NA NA NA NA
Seat Belt NA NA NA NA NA NA
No Restraint Observed 2% 1% 2% 1% 0 34%
Children 1 to 3 Years Old
Rear-Facing Car Seat 3% 0% 7% 1% 4 100%
Forward-Facing Car Seat 76% 2% 75% 1% -1 22%
High-Backed Booster Seat 11% 2% 9% 1% -2 66%
Backless Booster Seat 3% 0% 3% 0% 0 55%
Seat Belt 4% 1% 2% 0% -2 97%
No Restraint Observed 4% 1% 4% 1% 0 0%
Children 4 to 7 Years Old
Rear-Facing Car Seat NA NA 0% 0% NA NA
Forward-Facing Car Seat 14% 2% 18% 1% 4 92%
High-Backed Booster Seat 24% 3% 25% 1% 1 31%
Backless Booster Seat 17% 2% 21% 1% 4 86%
Seat Belt 32% 2% 25% 1% -7 99%
No Restraint Observed 13% 3% 10% 1% -3 57%
Children 8 to 12 Years Old
Rear-Facing Car Seat NA NA NA NA NA NA
Forward-Facing Car Seat 1% 1% 1% 0% 0 51%
High-Backed Booster Seat 2% 1% 3% 0% 1 80%
Backless Booster Seat 3% 0% 5% 0% 2 100%
Seat Belt 79% 1% 79% 1% 0 2%
No Restraint Observed 15% 2% 12% 1% -2 74%
1
Survey data are obtained on children from birth to 12 years old in passenger vehicles at a nationwide probability sample of gas stations, day
care centers, recreation centers, and restaurants in five fast-food chains.
2
Estimates might not sum to totals due to rounding.
3
Restraint use is observed by trained data collectors prior to or just as the vehicle comes to a stop, except in the case of observation at fast-food
drive-through lanes, where restraint use is observed prior to the vehicle reaching the drive-through window
4
The degree of statistical confidence that the 2011 use rate is different from the 2009 rate. Confidences that meet or exceed 90 percent are
formatted in boldface type.
NA: Data not sufficient to produce a reliable estimate
Source: The National Survey of the Use of Booster Seats, NHTSA’s National Center for Statistics and Analysis, 2009, 2011
21
Table 4: The Types of Restraints Used by Children From Birth to 12 Years Old, by Weight
Restraint Type
1
2009
2011
2009-2011 Change
Percentage
2
of Children
3
Observed
Using the
Restraint
Type
Standard
Error
Percentage
2
of Children
3
Observed
Using the
Restraint
Type
Standard
Error
Change in
Percentage
Points
Confidence
in a Change
in
Percentage
4
Children Who Weigh Less Than 20 Pounds
Rear-Facing Car Seat 83% 3% 89% 2% 6 95%
Forward-Facing Car Seat 15% 2% 9% 2% -6 96%
High-Backed Booster Seat NA NA NA NA NA NA
Backless Booster Seat NA NA NA NA NA NA
Seat Belt NA NA NA NA NA NA
No Restraint Observed 1% 1% 2% 1% 1 48%
Children Who Weigh Between 20 and 40 Pounds
Rear-Facing Car Seat 4% 1% 7% 1% 3 98%
Forward-Facing Car Seat 59% 4% 61% 2% 2 29%
High-Backed Booster Seat 16% 4% 14% 1% -2 39%
Backless Booster Seat 6% 1% 6% 1% 0 6%
Seat Belt 9% 1% 6% 1% -3 72%
No Restraint Observed 6% 1% 6% 1% 0 1%
Children Who Weigh Between 41 and 60 Pounds
Rear-Facing Car Seat NA NA NA NA NA NA
Forward-Facing Car Seat 8% 1% 11% 1% 3 93%
High-Backed Booster Seat 18% 2% 22% 1% 4 90%
Backless Booster Seat 17% 2% 23% 1% 6 99%
Seat Belt 42% 2% 34% 1% -8 100%
No Restraint Observed 15% 4% 10% 1% -5 77%
Children Who Weigh More Than 60 Pounds
Rear-Facing Car Seat NA NA NA NA NA NA
Forward-Facing Car Seat 0% 0% 1% 0% 1 98%
High-Backed Booster Seat 3% 1% 4% 0% 1 45%
Backless Booster Seat 4% 0% 6% 1% 2 100%
Seat Belt 79% 1% 77% 1% -2 71%
No Restraint Observed 14% 1% 13% 1% -1 64%
1
Survey data are obtained on children from birth to 12 years old in passenger vehicles at a nationwide probability sample of gas
stations, day care centers, recreation centers, and restaurants in five fast-food chains.
2
Estimates might not sum to totals due to rounding.
3
Restraint use is observed by trained data collectors prior to or just as the vehicle comes to a stop, except in the case of
observation at fast-food drive-through lanes, where restraint use is observed prior to the vehicle reaching the drive-through
window
4
The degree of statistical confidence that the 2011 use rate is different from the 2009 rate. Confidences that meet or exceed 90
percent are formatted in boldface type.
NA: Data not sufficient to produce a reliable estimate.
Source: The National Survey of the Use of Booster Seats, NHTSA’s National Center for Statistics and Analysis, 2009, 2011
22
Table 5: The Types of Restraints Used by Children From Birth to 12 Years Old, by Height
Restraint Type
1
2009
2011
2009-2011 Change
Percentage
2
of Children
3
Observed
Using the
Restraint
Type
Standard
Error
Percentage
2
of Children
3
Observed
Using the
Restraint
Type
Standard
Error
Change in
Percentage
Points
Confidence
in a Change
in
Percentage
4
Children Who Are at Most 36 Inches Tall
Rear-Facing Car Seat 15% 2% 17% 2% 2 76%
Forward-Facing Car Seat 58% 2% 60% 2% 1 79%
High-Backed Booster Seat 9% 2% 8% 1% -1 49%
Backless Booster Seat 4% 1% 4% 0% 0 15%
Seat Belt 8% 1% 5% 1% -3 98%
No Restraint Observed 6% 1% 5% 1% -1 42%
Children Who Are Between 37 and 53 Inches Tall
Rear-Facing Car Seat NA NA 0% 0% NA NA
Forward-Facing Car Seat 16% 2% 20% 1% 4 76%
High-Backed Booster Seat 19% 3% 20% 1% 1 33%
Backless Booster Seat 13% 1% 17% 1% 4 99%
Seat Belt 39% 2% 33% 1% -6 100%
No Restraint Observed 12% 3% 10% 1% -2 55%
Children Who Are Between 54 and 56 Inches Tall
Rear-Facing Car Seat NA NA NA NA NA NA
Forward-Facing Car Seat 1% 1% 2% 1% 1 43%
High-Backed Booster Seat 2% 0% 5% 1% 3 100%
Backless Booster Seat 4% 1% 8% 1% 4 98%
Seat Belt 78% 3% 72% 2% -6 95%
No Restraint Observed 15% 2% 13% 2% -2 56%
Children Who Are Taller Than 56 Inches
Rear-Facing Car Seat NA NA NA NA NA NA
Forward-Facing Car Seat NA NA NA NA NA NA
High-Backed Booster Seat 1% 0% 1% 0% 0 88%
Backless Booster Seat 1% 1% 1% 0% 0 40%
Seat Belt 85% 2% 86% 2% 1 54%
No Restraint Observed 13% 2% 10% 1% -3 86%
1
Survey data are obtained on children from birth to 12 years old in passenger vehicles at a nationwide probability sample of gas stations, day
care centers, recreation centers, and restaurants in five fast-food chains.
2
Estimates might not sum to totals due to rounding.
3
Restraint use is observed by trained data collectors prior to or just as the vehicle comes to a stop, except in the case of observation at fast-
food drive-through lanes, where restraint use is observed prior to the vehicle reaching the drive-through window
4
The degree of statistical confidence that the 2011 use rate is different from the 2009 rate. Confidences that meet or exceed 90 percent are
formatted in boldface type.
NA: Data not sufficient to produce a reliable estimate.
Source: The National Survey of the Use of Booster Seats, NHTSA’s National Center for Statistics and Analysis, 2009, 2011
23
4. Demographic Results
Although its primary purpose is to estimate booster seat use among 4- to 7-year-olds, the NSUBS
has information on the restraint use of all children under age 13 as well as information on
race/ethnicity for occupants of all ages. This section reports some major demographic results of
child restraint use from the 2011 NSUBS.
It should be noted that if a column corresponding to a data series or a data category is missing
from a figure in this section, it means that there are not sufficient data to produce a reliable
estimate for the data category. Also note that sometimes estimates might not sum to totals due to
rounding.
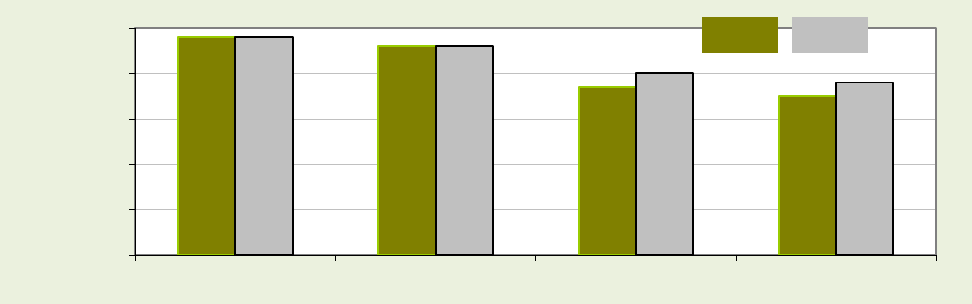
Overall, restraint use for all children from birth to 12 years old increased from 89 percent in 2009
to 91 percent in 2011.
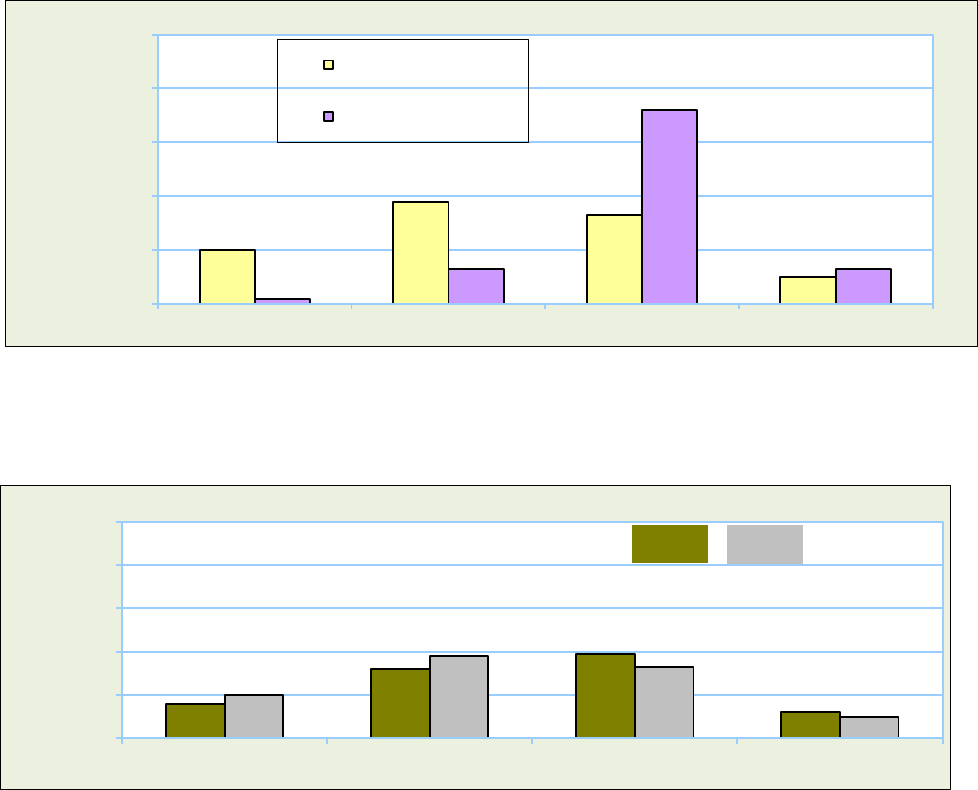
Age
The restraint use rates for children from birth to 12 months old, 1 to 3 years old, 4 to 7 years old
and 8 to 12 years old in 2011 were 98 percent, 96 percent, 90 percent, and 88 percent
respectively. Figure 14 compares the restraint use of children 0-12 years by age in 2009 and
2011. It should be noted that the restraint use in Figure 14 includes any type of restraint, even
those that may be inappropriate for a child’s age, weight and height.
98%
96%
87%
85%
98%
96%
90%
88%
50%
60%
70%
80%
90%
100%
Age 0-12 Months Age 1-3 Years Age 4-7 Years Age 8-12 Years
Restraint Use, in
Percent
2009 2011
Figure 14: Child Restraint Use by Age and Year
Race and Ethnicity
Unlike the National Occupant Protection Use Survey (NOPUS) in which racial information of
vehicle occupants is obtained by visual assessment, NSUBS data collectors conduct interviews to
obtain race and ethnicity of passenger vehicle occupants including all child occupants under age 13.
24
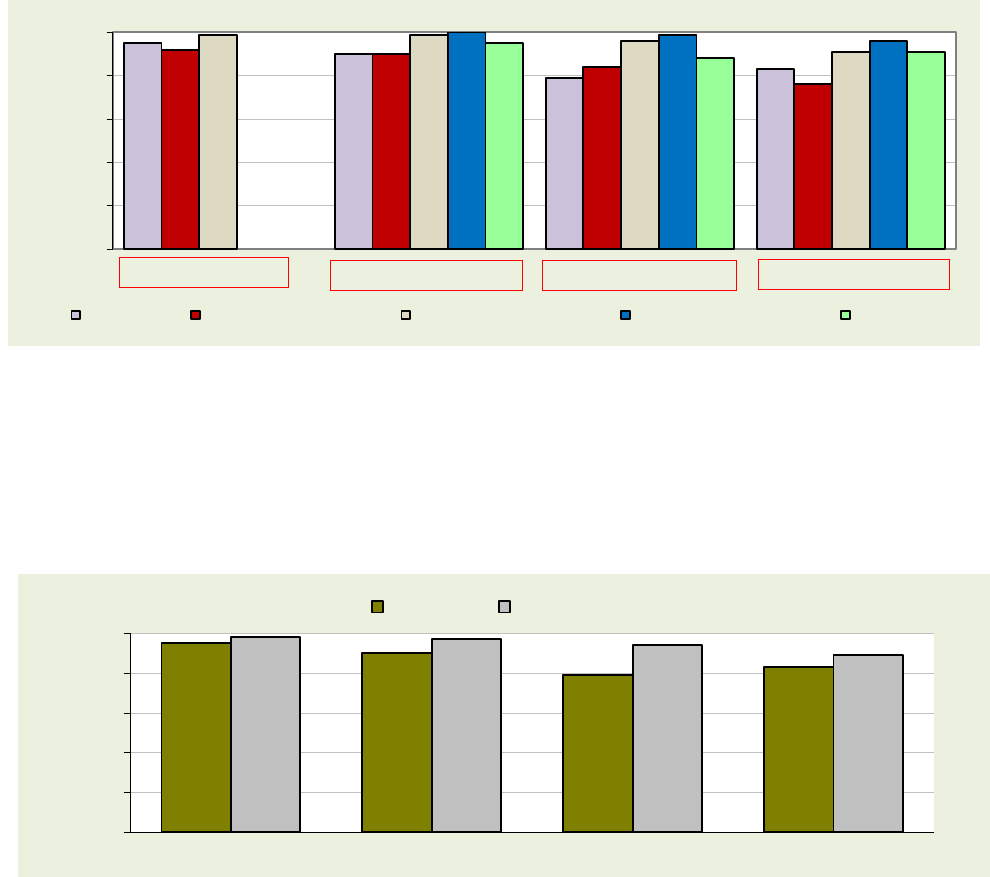
Figure 15 shows the overall picture of child restraint use by race and ethnicity across all age
groups.
95%
90%
79%
83%
92%
90%
84%
76%
99%
99%
96%
91%
100%
99%
96%
95%
88%
91%
0%
20%
40%
60%
80%
100%
Restraint Use
Hispanic Black Non-Hispanic White Non-Hispanic Asian Non-Hispanic Other
Age 1-3 Years
Age 4-7 Years
Age 8-12 Years
Age 0-12 Months
As shown in Figures 16, Hispanics had significantly lower restraint use rates than Non-Hispanics
among children from birth to 12 years old.
Figure
15: Child Restraint Use by Age and Race/Ethnicity in 2011
95%
90%
79%
83%
98%
97%
94%
89%
0%
20%
40%
60%
80%
100%
Age 0-12 Months Age 1-3 Years Age 4-7 Years Age 8-12 Years
Restraint Use
Hispanic Not Hispanic
Figure 16: C
hild Restraint Use by Age and Hispanic Origin in 2011
The 2011 NSUBS also shows that restraint use among children 4 to 7 years old 4 to 7 years old
who are Non-Hispanic White increased significantly to 96 percent in 2011 from 93 percent in
2009 (Table 8). Restraint use among Non-Hispanic Asian children age 8 to 12 years old
increased significantly to 96 percent in 2011 from 80 percent in 2009 (Table 9).
Race and ethnicity data in the NSUBS is collected in accordance with Federal standards set forth
by the Office of the Management and Budget (OMB). Specifically, the following 10
race/ethnicity categories are employed in the survey data collection:
25
Not Hispanic nor Latino and
• American Indian or Alaska Native
• Asian
• Black or African-American
• Native Hawaiian or Pacific Islander
• White
Hispanic or Latino and
• American Indian or Alaska Native
• Asian
• Black or African-American
• Native Hawaiian or Pacific Islander
• White
The NSUBS data collectors ask an adult occupant of a vehicle (usually the driver) to report the
race and ethnicity of all occupants. Respondents reporting themselves (or others) to be
multiracial are recorded by the data collector as such.
Because of insufficient numbers of children observed in certain race/ethnic groups, we report the
NSUBS data using the following five collapsed race/ethnicity groups:
• Hispanic or Latino
• White Non-Hispanic
• Black or African-American Non-Hispanic
• Asian Non-Hispanic
• Other Non-Hispanic (which comprises people not of Hispanic origin who are American
Indian, Alaska Native, Native Hawaiian or Pacific Islander)
For information on the OMB standards for the collection of race and ethnicity data in
government surveys, please see “Revisions to the Standards for the Classification of Federal
Data on Race and Ethnicity, Federal Register Notice, Volume 62, Number 210, pages 58781-
58790, October 30, 1997,” available at www.omb.gov.
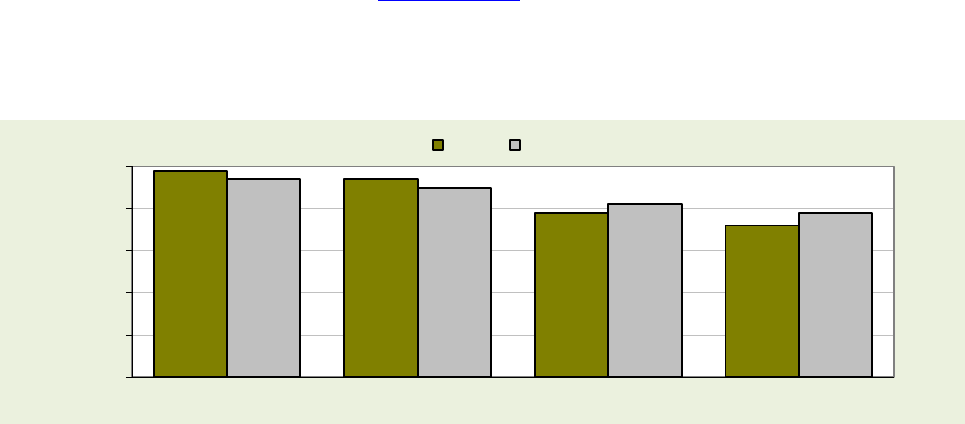
Gender
Figure 17 shows that the restraint use rates among boys and girls across the age groups in 2011.
99%
97%
89%
86%
97%
95%
91%
89%
50%
60%
70%
80%
90%
100%
Age 0-12 Months Age 1-3 Years Age 4-7 Years Age 8-12 Years
Restraint Use
Boys Girls
Figure 17: Child Restraint Use by Age and Gender in 2011
26
Table 6: Restraint Use Among Children From Birth to 12 Months Old
Subgroup of Children Age 0-12
Months
1,4
2009 2011 2009-2011 Change
Estimated
Restraint
Use
2
Confidence
That Use Is
High or Low
in Group
3
Estimated
Restraint
Use
2
Confidence
That Use Is
High or Low
in Group
3
Change in
Percentage
Points
Confidence in
a Change in
Use
5
All Children Age 0-12 Months
98%
98%
0
34%
Children Who Are
Boys
97%
91%
99%
90%
2
72%
Girls
99%
91%
97%
90%
-2
87%
Children Who Are Reported to Be
4
White Non-Hispanic
99%
96%
99%
97%
0
39%
Black or African-American Non-Hispanic
98%
56%
92%
86%
-6
76%
Asian Non-Hispanic
NA
NA
NA
NA
NA
NA
Other Non-Hispanic
NA
NA
NA
NA
NA
NA
Hispanic or Latino
94%
95%
95%
87%
1
19%
Children Reported to Be
4
Hispanic or Latino
94%
95%
95%
87%
1
19%
Neither Hispanic nor Latino
99%
95%
98%
87%
-1
72%
Children Whose Height
4
Is Between
0 and 36 Inches
98%
0%
98%
95%
0
34%
37 and 53 Inches
NA
NA
NA
NA
NA
NA
54 and 56 Inches
NA
NA
NA
NA
NA
NA
57 Inches or More
NA
NA
NA
NA
NA
NA
Children Who Weigh
4
Between
0 and 19 Pounds
99%
83%
99%
94%
0
35%
20 and 40 Pounds
97%
83%
95%
94%
-2
61%
41 and 60 Pounds
NA
NA
NA
NA
NA
NA
61 Pounds or More
NA
NA
NA
NA
NA
NA
Children Surveyed at a
Gas Station
97%
88%
94%
92%
-3
48%
Fast Food Restaurant
96%
90%
95%
80%
-1
3%
Day Care Center
100%
98%
99%
98%
-1
38%
Recreation Center
NA
NA
NA
NA
NA
NA
1
Survey data are obtained on children from birth to 12 years old in passenger vehicles at a nationwide probability sample of gas
stations, day care centers, recreation centers, and restaurants in five fast food chains.
2
Use of car seats (forward- or rear-facing), booster seats, and seat belts. Restraint use is observed by trained data collectors prior
to or just as the vehicle comes to a stop, except in the case of observation at fast food drive-through lanes, where restraint use is
observed prior to the vehicle reaching the drive-through window.
3
The statistical confidence that use in the occupant group (e.g., child occupants who are boys) is higher or lower than use in the
corresponding complementary occupant group (e.g., child occupants who are girls). Confidences that meet or exceed 90 percent
are formatted in boldface type. Confidences are rounded to the nearest percentage point, and so confidences reported as “100
percent” are between 99.5 percent and 100 percent.
27
4
Race, ethnicity, height, weight, and age of children are obtained by asking an adult occupant.
5
The degree of statistical confidence that the 2011 use rate is different from the 2009 rate. Confidences that meet or exceed 90
percent are formatted in boldface type.
NA: Data not sufficient to produce a reliable estimate.
Source: The National Survey of the Use of Booster Seats, NHTSA’s National Center for Statistics and Analysis, 2009, 2011
Table 7: Restraint Use Among Children 1 to 3 Years Old
Subgroup of Children 1 to 3
Years Old
1,4
2009
2011
2009-2011 Change
Estimated
Restraint
Use
2
Confidence
That Use Is
High or Low
in Group
3
Estimated
Restraint
Use
2
Confidence
That Use Is
High or Low
in Group
3
Change in
Percentage
Points
Confidence in
a Change in
Use
5
All Children 1 to 3 Years Old
96% 96% 0
3%
Children Who Are
Boys
96%
79%
97%
98%
2
35%
Girls
95%
79%
95%
98%
0
29%
Children Who Are Reported to Be
4
White Non-Hispanic
99%
100%
99%
100%
0
64%
Black or African-American Non-Hispanic
92%
98%
90%
98%
-2
48%
Asian Non-Hispanic
100%
100%
100%
100%
0
65%
Other Non-Hispanic
99%
100%
95%
56%
-4
86%
Hispanic or Latino
88%
100%
90%
100%
2
57%
Children Reported to Be
4
Hispanic or Latino
88%
100%
90%
100%
2
57%
Neither Hispanic nor Latino
98%
100%
97%
100%
-1
68%
Children Whose Height
4
Is Between
0 and 36 Inches
96%
69%
97%
99%
1
59%
37 and 53 Inches
96%
69%
93%
99%
-3
90%
54 and 56 Inches
NA
NA
NA
NA
NA
NA
57 Inches or More
NA
NA
NA
NA
NA
NA
Children Who Weigh
4
Between
0 and 19 Pounds
100%
100%
92%
93%
-8
100%
20 and 40 Pounds
96%
98%
96%
97%
0
21%
41 and 60 Pounds
86%
99%
94%
91%
7
93%
61 Pounds or More
NA
NA
NA
NA
NA
NA
Children Surveyed at a
Gas Station
89%
100%
93%
97%
4
98%
Fast Food Restaurant
93%
93%
92%
98%
-1
67%
Day Care Center
97%
100%
97%
100%
0
5%
Recreation Center
99%
100%
98%
98%
0
27%
1
Survey data are obtained on children from birth to 12 years old in passenger vehicles at a nationwide probability sample of gas
stations, day care centers, recreation centers, and restaurants in five fast food chains.
2
Use of car seats (forward- or rear-facing), booster seats, and seat belts. Restraint use is observed by trained data collectors prior
to or just as the vehicle comes to a stop, except in the case of observation at fast food drive-through lanes, where restraint use is
observed prior to the vehicle reaching the drive-through window.
3
The statistical confidence that use in the occupant group (e.g., child occupants who are boys) is higher or lower than use in the
corresponding complementary occupant group (e.g., child occupants who are girls). Confidences that meet or exceed 90 percent
are formatted in boldface type. Confidences are rounded to the nearest percentage point, and so confidences reported as “100
percent” are between 99.5 percent and 100 percent.
4
Race, ethnicity, height, weight, and age of children are obtained by asking an adult occupant.
5
The degree of statistical confidence that the 2011 use rate is different from the 2009 rate. Confidences that meet or exceed 90
percent are formatted in boldface type.
NA: Data not sufficient to produce a reliable estimate.
Source: The National Survey of the Use of Booster Seats, NHTSA’s National Center for Statistics and Analysis, 2009, 2011

28
Table 8: Restraint Use Among Children 4 to 7 Years Old
Subgroup of Children 4 to 7
Years Old
1,4
2009
2011
2009-2011 Change
Estimated
Restraint
Use
2
Confidence
That Use Is
High or Low
in Group
3
Estimated
Restraint
Use
2
Confidence
That Use Is
High or Low
in Group
3
Change in
Percentage
Points
Confidence
in a Change
in Use
5
All Children 4 to 7 Years Old
87% 90% 3 57%
Children Who Are
Boys
87%
53%
89%
90%
2
55%
Girls
87%
53%
91%
90%
4
57%
Children Who Are Reported to Be
4
White Non-Hispanic
93%
99%
96%
100%
3
100%
Black or African-American Non-Hispanic
83%
88%
84%
99%
1
19%
Asian Non-Hispanic
97%
100%
99%
100%
2
59%
Other Non-Hispanic
94%
98%
88%
72%
-6
83%
Hispanic or Latino
74%
96%
79%
100%
5
33%
Children Reported to Be
4
Hispanic or Latino
74%
96%
79%
100%
5
33%
Neither Hispanic nor Latino
91%
96%
94%
100%
3
100%
Children Whose Height
4
Is Between
0 and 36 Inches
85%
90%
87%
98%
2
29%
37 and 53 Inches
88%
80%
91%
98%
3
62%
54 and 56 Inches
94%
96%
89%
68%
-5
85%
57 Inches or More
79%
80%
91%
58%
12
74%
Children Who Weigh
4
Between
0 and 19 Pounds
NA
NA
NA
NA
NA
NA
20 and 40 Pounds
90%
98%
91%
67%
1
9%
41 and 60 Pounds
84%
98%
91%
78%
7
82%
61 Pounds or More
91%
85%
87%
93%
-4
91%
Children Surveyed at a
Gas Station
78%
100%
86%
97%
8
98%
Fast Food Restaurant
84%
86%
83%
95%
-1
1%
Day Care Center
89%
89%
94%
99%
5
49%
Recreation Center
90%
79%
94%
95%
4
93%
1
Survey data are obtained on children from birth to 12 years old in passenger vehicles at a nationwide probability sample of gas
stations, day care centers, recreation centers, and restaurants in five fast food chains.
2
Use of car seats (forward- or rear-facing), booster seats, and seat belts. Restraint use is observed by trained data collectors prior
to or just as the vehicle comes to a stop, except in the case of observation at fast food drive-through lanes, where restraint use is
observed prior to the vehicle reaching the drive-through window.
3
The statistical confidence that use in the occupant group (e.g., child occupants who are boys) is higher or lower than use in the
corresponding complementary occupant group (e.g., child occupants who are girls). Confidences that meet or exceed 90 percent
are formatted in boldface type. Confidences are rounded to the nearest percentage point, and so confidences reported as “100
percent” are between 99.5 percent and 100 percent.
4
Race, ethnicity, height, weight, and age of children are obtained by asking an adult occupant.
5
The degree of statistical confidence that the 2011 use rate is different from the 2009 rate. Confidences that meet or exceed 90
percent are formatted in boldface type.
NA: Data not sufficient to produce a reliable estimate.
Source: The National Survey of the Use of Booster Seats, NHTSA’s National Center for Statistics and Analysis, 2009, 2011
29
Table 9: Restraint Use Among Children 8 to 12 Years Old
Subgroup of Children 8 to 12
Years Old
1,4
2009
2011
2009-2011 Change
Estimated
Restraint
Use
2
Confidence
That Use Is
High or Low
in Group
3
Estimated
Restraint
Use
2
Confidence
That Use Is
High or Low
in Group
3
Change in
Percentage
Points
Confidence
in a Change
in Use
5
All Children Age 8-12
85% 88% 3 74%
Children Who Are
Boys
86%
70%
86%
92%
0
4%
Girls
85%
70%
89%
92%
4
98%
Children Who Are Reported to Be
4
White Non-Hispanic
91%
100%
91%
100%
0
29%
Black or African-American Non-Hispanic
75%
100%
76%
100%
1
7%
Asian Non-Hispanic
80%
79%
96%
100%
16
98%
Other Non-Hispanic
90%
85%
91%
85%
1
19%
Hispanic or Latino
79%
100%
83%
96%
4
62%
Children Reported to Be
4
Hispanic or Latino
79%
100%
83%
96%
4
62%
Neither Hispanic nor Latino
88%
100%
89%
96%
1
61%
Children Whose Height
4
Is Between
0 and 36 Inches
NA
NA
NA
NA
NA
NA
37 and 53 Inches
85%
60%
87%
85%
2
38%
54 and 56 Inches
83%
81%
87%
81%
4
78%
57 Inches or More
87%
88%
90%
98%
3
80%
Children Who Weigh
4
Between
0 and 19 Pounds
NA
NA
NA
NA
NA
NA
20 and 40 Pounds
NA
NA
NA
NA
NA
NA
41 and 60 Pounds
87%
76%
88%
63%
1
15%
61 Pounds or More
85%
78%
87%
69%
2
84%
Children Surveyed at a
Gas Station
77%
99%
85%
92%
8
99%
Fast Food Restaurant
86%
59%
84%
96%
-2
32%
Day Care Center
87%
79%
93%
99%
6
85%
Recreation Center
89%
84%
91%
88%
2
58%
1
Survey data are obtained on children from birth to 12 years old in passenger vehicles at a nationwide probability sample of gas
stations, day care centers, recreation centers, and restaurants in five fast food chains.
2
Use of car seats (forward- or rear-facing), booster seats, and seat belts. Restraint use is observed by trained data collectors prior
to or just as the vehicle comes to a stop, except in the case of observation at fast food drive-through lanes, where restraint use is
observed prior to the vehicle reaching the drive-through window.
3
The statistical confidence that use in the occupant group (e.g., child occupants who are boys) is higher or lower than use in the
corresponding complementary occupant group (e.g., child occupants who are girls). Confidences that meet or exceed 90 percent
are formatted in boldface type. Confidences are rounded to the nearest percentage point, and so confidences reported as “100
percent” are between 99.5 percent and 100 percent.
4
Race, ethnicity, height, weight, and age of children are obtained by asking an adult occupant.
5
The degree of statistical confidence that the 2011 use rate is different from the 2009 rate. Confidences that meet or exceed 90
percent are formatted in boldface type.
NA: Data not sufficient to produce a reliable estimate.
Source: The National Survey of the Use of Booster Seats, NHTSA’s National Center for Statistics and Analysis, 2009, 2011
30
5. Occupants Traveling With Children
Although its primary purpose is to estimate booster seat use among 4- to 7-year-olds, the NSUBS
also collects information on the race and ethnicity of other occupants traveling with children.
This section reports the restraint use, by major race and ethnicity results, of occupants traveling
with children from the 2011 NSUBS.
The NSUBS data collectors approach passenger vehicles appearing to have child occupants
under age 13, observe the restraint use of up to nine occupants in the first three rows of seats, and
conduct interviews to obtain the race and ethnicity of all occupants. The approximate ages of
non-child occupants (expressed as an age range, such as 16-24 years) and the genders of all
occupants are subjectively assessed by the data collectors. Since race and ethnicity of all
occupants are obtained through interviews instead of subjective assessment of data collectors as
in NOPUS and most other observational surveys, NSUBS provides more accurate estimates on
race and ethnicity of passenger vehicles occupants. However, it should be noted that by design
and necessity, the NSUBS survey only collects restraint use of vehicle occupants who are
transporting or riding with children under age 13 to a restricted set of sites such as gas stations,
day care centers, recreation centers, and restaurants in five fast food chains, not of all vehicle
occupants on the road.
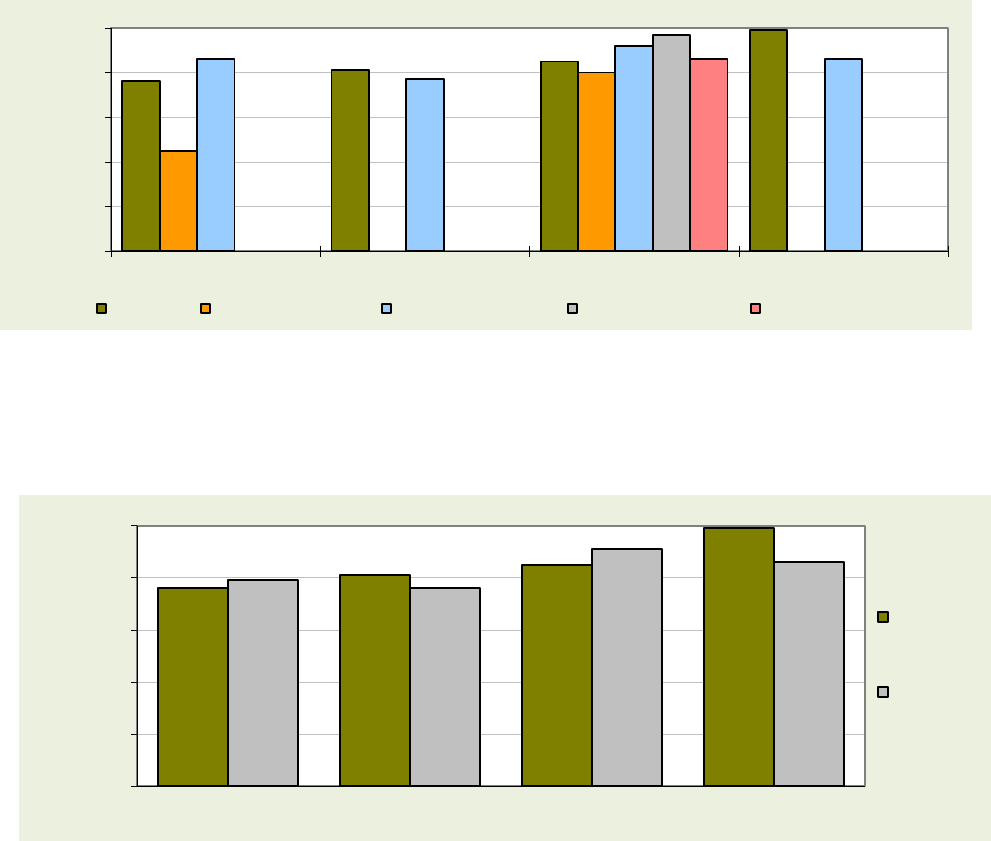
The major findings from the 2011 survey on the demographic characteristics of occupants
traveling with children include the following:
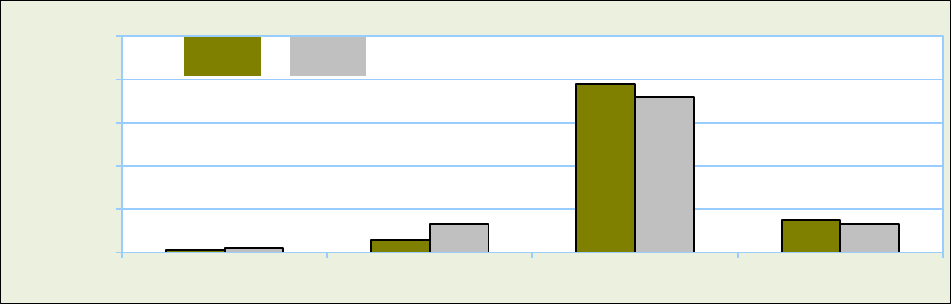
• Seat belt use continued to be statistically significantly lower for Hispanics, and for non-
Hispanic Black or African Americans, than other race and ethnicity groups among
passenger vehicle occupants age 25-69 years traveling with children (Figure 18 and
Figure 19).
• Seat belt use continued to be statistically significantly higher for non-Hispanic Asians,
and for non-Hispanic Whites, than other race and ethnicity groups among passenger
vehicle occupants age 25-69 years traveling with children (Figure 18).
• Among occupants age 25-69 years, restraint use for non-Hispanic occupants increased
significantly from 88 percent in 2009 to 91 percent in 2011; restraint use for Asian non-
Hispanic occupants increased significantly from 92 percent in 2009 to 97 percent in 2011
(Table 10).
• Among occupants age 13-15 years, restraint use for non-Hispanic occupants increased
significantly from 70 percent in 2009 to 79 percent in 2011; restraint use for White non-
Hispanic occupants increased significantly from 73 percent in 2009 to 86 percent in 2011
(Table 10).
It should be noted that if a column corresponding to a data series or a data category is missing
from a figure in this section, it means that there are not sufficient data to produce a reliable
estimate for the data category. Also note that sometimes estimates might not sum to totals due to
rounding.
31
76%
81%
85%
99%
45%
80%
86%
77%
92%
86%
97%
86%
0%
20%
40%
60%
80%
100%
Age 13-15 Years Age 16-24 Years Age 25-69 Years Over 70 Years
Restraint Use
Hispanic Black Non-Hispanic White Non-Hispanic Asian Non-Hispanic Other Non-Hispanic
Figure
18: Restraint Use by Age and Race/Ethnicity for Occupants Traveling With Children in 2011
76%
81%
85%
99%
79%
76%
91%
86%
0%
20%
40%
60%
80%
100%
Age 13-15 Age 16-24 Age 25-69 Age Over 70
Restraint Use
Hispanic
Not
Hispanic
Figure 19: Restraint Use by Age and Hispanic Origin for Occupants Traveling With Children in 2011
32
Table 10: Restraint Use of Occupants Traveling With Children by Age and Race/Ethnicity
Subgroup of Occupants
1
2009
2011
2009-2011 Change
Estimated
Restraint
Use
2
Standard
Error
Confidence
That Use
Is High or
Low in
Group
3
Estimated
Restraint
Use
2
Standard
Error
Confidence
That Use
Is High or
Low in
Group
3
Change in
Percentage
Points
Confidence
in a
Change in
Use
4
Occupants Age 13-15 Years
Occupants Reported to Be
5
White Non-Hispanic
73% 6% 90% 86% 4% 100% 13 99%
Black or African-American Non-
Hispanic
61% 12% 77% 45% 14% 100% -16 79%
Asian Non-Hispanic
NA NA NA NA NA NA NA NA
Other Non-Hispanic
NA NA NA NA NA NA NA NA
Hispanic or Latino
66% 4% 80% 76% 12% 68% 10 63%
Occupants Reported to Be
5
Hispanic or Latino
66% 4% 80% 76% 12% 68% 10 63%
Neither Hispanic nor Latino
70% 4% 80% 79% 5% 68% 9 98%
Occupants Age 16-24 Years
Occupants Reported to Be
5
White Non-Hispanic
80% 6% 84% 77% 7% 58% -3 35%
Black or African-American Non-
Hispanic
NA NA NA NA NA NA NA NA
Asian Non-Hispanic
NA NA NA NA NA NA NA NA
Other Non-Hispanic
NA NA NA NA NA NA NA NA
Hispanic or Latino
92% 5% 96% 81% 7% 79% -11 89%
Occupants Reported to Be
5
Hispanic or Latino
92% 5% 96% 81% 7% 79% -11 89%
Neither Hispanic nor Latino
80% 5% 96% 76% 6% 79% -4 48%
Occupants Age 25-69 Years
Occupants Reported to Be
5
White Non-Hispanic
90%
1%
100%
92%
1%
100%
2
88%
Black or African-American Non-
Hispanic
77% 3% 100% 80% 5% 100% 3 55%
Asian Non-Hispanic
92% 2%
100%
97% 2%
100%
5
100%
Other Non-Hispanic
76%
6%
98%
86%
5%
85%
10
86%
Hispanic or Latino
84%
2%
99%
85%
4%
99%
1
20%
Occupants Reported to Be
5
Hispanic or Latino
84% 2%
99%
85% 4%
99%
1 20%
Neither Hispanic nor Latino
88% 1%
99%
91% 1%
99%
3
99%
Occupants Over 70 Years
Occupants Reported to Be
5
White Non-Hispanic
89% 5% 62% 86% 9%
98%
-3 32%
Black or African-American Non-
Hispanic
NA NA NA NA NA NA NA NA
Asian Non-Hispanic
NA NA NA NA NA NA NA NA
Other Non-Hispanic
NA NA NA NA NA NA NA NA
Hispanic or Latino
NA
NA
NA
99%
2%
99%
NA
NA
Occupants Reported to Be
5
Hispanic or Latino
NA NA NA 99% 2% 99% NA NA
Neither Hispanic nor Latino
90% 4% 68% 86% 9%
99%
-4 35%
33
1 Survey data are obtained on drivers and passengers of passenger vehicles appearing to contain a child under 13 years old at a
nationwide probability sample of gas stations, day care centers, recreation centers, and restaurants in five fast food chains.
2 Restraint use is observed by trained data collectors prior to or just as the vehicle comes to a stop, except in the case of
observation at fast food drive-through lanes, where restraint use is observed prior to the vehicle reaching the drive-through
window.
3 The statistical confidence that use in the occupant group (e.g., occupants who are Hispanic or Latino) is higher or lower than
use in the corresponding complementary occupant group (e.g., occupants who are neither Hispanic nor Latino). Confidences that
meet or exceed 90 percent are formatted in boldface type. Confidences are rounded to the nearest percentage point, and so
confidences reported as “100 percent” are between 99.5 percent and 100.0 percent.
4 The degree of statistical confidence that the 2011 use rate is different from the 2009 rate. Confidences that meet or exceed 90
percent are formatted in boldface type.
5 Race and ethnicity of all occupants are obtained by interviewing an adult occupant in the vehicle (usually the driver).
Note: some estimates have large standard errors, e.g., standard error for belt use among Non-Hispanic Blacks or Africans age 13-
15 years was 14 percent in 2011, which means that the margin of error for this estimate was +/- 28 percentage points, and thus the
estimate could be as low as 17 percent.
NA: Data not sufficient to produce a reliable estimate.
Source: The National Survey of the Use of Booster Seats, NHTSA’s National Center for Statistics and Analysis, 2009, 2011

34
6. NSUBS Methodology
This section discusses briefly the sample design, sample size, data collection, and estimation
used in the 2011 NSUBS. For more details on the methodology of the survey, refer to “The 2006
National Survey of the Use of Booster Seats – Methodology Report” (Glassbrenner, 2009) that is
available at www-nrd.nhtsa.dot.gov/Pubs/811111.PDF.
Sample Design
The NSUBS uses a complex multi-stage probability sample. The primary sampling unit (PSU)
sampling frame consists of the 50 sampled PSUs from the National Occupant Protection Use
Survey (NOPUS) of 2005, the year when the NSUBS was designed. For more information on the
NOPUS PSUs, refer to “The Safety Belt and Helmet Use in 2002 – Overall Results”
(Glassbrenner, 2002). As a first step to select the NSUBS PSUs, 16 NOPUS PSUs were selected
from the above sampling frame: two with certainty (i.e., probability one) and 14 using equal
probability systematic sampling. Then, each of the selected 16 NOPUS PSUs was partitioned
into county groups (i.e., a county or two neighboring counties) resulting in a total of 43 county
groups. A single county group was selected from each of the 16 partitioned NOPUS PSUs using
probability proportional to size (PPS) sampling with the population of children under 5 based on
the 2000 Census as a measure of size. The selected 16 county groups form the sampled PSUs of
the NSUBS.
The site sampling frame consists of gas stations, recreation centers, day care centers, and
restaurants in five fast food chains in the 16 sampled NSUBS PSUs. These four site types make
four strata. The 2011 NSUBS selected 700 sites using stratified systematic sampling from the
above sampling frame.
Sample Size
Due to the nature of the survey, the NSUBS data collectors have to obtain cooperation from the
sample sites. Cooperation with recreation centers and day care centers is obtained in advance by
visiting these sites via sending letters requesting cooperation followed by phone calls to secure
cooperation. For fast food restaurants and gas stations, trained data collectors approach each
establishment in person to secure cooperation.
For the 2011 NSUBS, a total of 405 sites of the 700 sampled sites gave permission for the survey
to be conducted on their premises. The cooperation rate was 58 percent. Of these 405 data
collection sites, 158 were gas stations, 123 fast food restaurants, 93 day care centers, and 31
recreation centers.
Table 11 shows the observed sample size of the 2011 NSUBS. A total of 18,284 occupants were
observed in the 6,350 vehicles at the 405 data collection sites. Of these observed occupants,
9,849 were children age 0-12 years. The data on 8,050 children from birth to 12 years old were
obtained by interviews with adult occupants who were traveling together with those children.
35
Table 11: Sites, Vehicles, Occupants, and Children From Birth to 12 Years Old in
NSUBS
Numbers of 2009 2011
Percentage
Change
Data Collection Sites 433 405 -6%
Vehicles Observed 6,033 6,350 5%
Occupants Observed 17,793 18,284 3%
Children From Birth to 12 Years Old
Observed
9,471 9,849 4%
Children From Birth to 12 Years Old
Interviewed*
7,284 8,050 11%
* Data obtained by interview with an adult occupant.
Data Collection
The 2011 NSUBS data collection was conducted between 7 a.m. and 6 p.m. during the period
from July 14, 2011, to August 1, 2011.
Trained data collectors approach passenger vehicles appearing to have child occupants under age
of 13; observe the restraint use of up to nine occupants in the first three rows of seats; and
conduct interviews to obtain the race and ethnicity of all occupants and the heights, weights, and
ages of child occupants appearing to be under age 13. The approximate ages of other occupants
(expressed as an age range, such as 16-24 years) and the genders of all occupants are
subjectively assessed by the data collectors.
Note that the data on race/ethnicity in the NSUBS are collected in compliance with Office
Management Budget (OMB) standards. NHTSA obtained approval to collect race/ethnicity data
for the 2006-2009 surveys under OMB clearance number 2127-0644. The notice of OMB
review can be found in the Federal Register, Volume 71, Number 30, page 7824, February 14,
2006.
In order to capture restraint use before children unfasten the restraints, data collectors observe
restraint use prior to or just as the vehicle comes to a stop except fast food drive-through lanes.
In that case, restraint use is observed prior to the vehicle reaching the drive-through window.
In order to reach as wide an audience as possible, the NSUBS uses some Spanish-speaking data
collectors.

36
Estimation
Let C denote the characteristic of occupants and R denote restraint type. The NSUBS estimates
the rate of occupants restrained in restraint type
R
among the occupants having characteristic
C
by the following formula,
∑
∑
=
kji
ijkijkijk
kji
ijkijkijk
CFw
CRFw
,,
,,
CR
UseRestraint
,
w
F
where
ijk
and
ijk
, respectively, denote the base weight and the product of various weight
j
CR
adjustment factors at the site
k
in the stratum of the PSU
i
.
ijk
stands for the number of
C
observed occupants having characteristic
C
and restrained in restraint type
R
and
ijk
denotes
number of observed occupants having characteristic
C
e
k
j
the at th site in the stratum of the
PSU
i
. For example, the booster seat use among 4- to 7- year- old children is estimated using
CR
the above formula, where
ijk
is the number of observed children age 4 to 7 years in booster
C
seat and
ijk
o 7 ye rs the site
k
j
is the number of observed children age 4 t a at in the stratum of
the PSU
i
.
Note that the NSUBS site sampling frame is restricted to the four site types: gas stations, day
care centers, recreation centers, and restaurants in five fast food chains as described in the
sample design sub-section. Since the NSUBS uses a probability sample of these site types, the
NSUBS estimates are national representative of children who frequently visit these types of sites.
For instance, 47 percent booster seat use among 4- to 7-year-old children as shown in Figure 1
means that among children in this age range who were taken by passenger vehicles to gas
stations, day care centers, recreation centers, or fast food restaurants in 2011, 47 percent were in
booster seats.
Please note that NHTSA employs the following suppression rule for the NSUBS publications:
Use estimates whose numerator is based on fewer than five persons observed, whose
denominator is based on fewer than 30 persons observed, or that are not statistically different
from 0% use (i.e. the standard error is at least half the point estimate) are to be suppressed. These
should be reported as “NA” in publications, and any related estimates (i.e., change in use and
confidence estimates) should also be suppressed.
This same rule was used for the NOPUS survey.
Please also note that suppressed estimates do not appear in the figures throughout this report
(displayed as missing columns in the figures).

37
7. References
Glassbrenner, D. (2002, September). Safety Belt and Helmet Use in 2002 – Overall Result.
(Report No. HS 809 500). Washington, DC: National Highway Traffic Safety Administration.
Glassbrenner, D. (2009, April). The 2006 National Survey of the Use of Booster Seats –
Methodology Report. (Report No. HS 811 111). Washington, DC: National Highway Traffic
Safety Administration.
Glassbrenner, D., & Ye, T. J. (2008a, January). Booster Seat Use in 2007, (Report No. HS 810
814). Washington, DC: National Highway Traffic Safety Administration.
Glassbrenner, D., & Ye, T. J. (2008b, January). Child Restraint Use in 2007 – Use of Correct
Restraint Types, (Report No. HS 810 895). Washington, DC: National Highway Traffic Safety
Administration.
Glassbrenner, D., & Ye, T. J. (2008c, January). Seat Belt Use in 2007 – Race and Ethnicity
Results Among Occupants Traveling With Children, (Report No. HS 810 896). Washington, DC:
National Highway Traffic Safety Administration.
Glassbrenner, D., & Ye, T. J. (2008d, January) Child Restraint Use in 2007 – Demographic
Results, (Report No. HS 810 897). Washington, DC: National Highway Traffic Safety
Administration
NHTSA. (2005, November). Improving the Safety of Older Child Passengers – “4 Steps for
Kids.” (Report No. DOT HS 809 953). Washington, DC: National Highway Traffic Safety
Administration.
NHTSA. (n/a). Car Seats and Booster Basics. Retrieved August 1, 2012, from
www.safercar.gov/parents/rightseat.htm
NHTSA. (2012). 2010 Traffic Safety Facts: Children. (Report No. DOT HS 811 641).
Washington, DC: National Highway Traffic Safety Administration.
Office of Management and Budget, Update of Statistical Area Definitions and Guidance on
Their Uses, OMB BULLETIN NO. 05-02, February 2005.
Pickrell, T. M., & Ye, T. J. (2009a, April). (2009, April). Seat Belt Use in 2008 – Race and
Ethnicity Results Among Occupants Traveling With Children, (Report No. DOT HS 811 107).
Washington, DC: National Highway Traffic Safety Administration.
Pickrell, T. M., & Ye, T. J. (2009b, May). Booster Seat Use in 2008, (Report No. DOT HS 811
121). Washington, DC: National Highway Traffic Safety Administration.
Pickrell, T. M., & Ye, T. J. (2009c, May) Child Restraint Use in 2008 – Use of Correct Restraint
Types, (Report No. DOT HS 811 132, May 2009. Washington, DC: National Highway Traffic
Safety Administration.
38
Pickrell, T. M., & Ye, T. J. (2009d, June). Child Restraint Use in 2008 – Demographic Results.
(Report No. DOT HS 811 148). Washington, DC: National Highway Traffic Safety
Administration.
Pickrell, T. M., & Ye, T. J. (2010, September). The 2009 National Survey of the Use of Booster
Seats, (Report No. DOT HS 811 377). Washington, DC: National Highway Traffic Safety
Administration.
Revisions to the Standards for the Classification of Federal Data on Race and Ethnicity, 62 Fed.
Reg. 210, pages 58781-58790, October 30, 1997.
Transportation Recall Enhancement, Accountability, and Documentation (TREAD) Act, 114
STAT. 1800. Public Law 106-414, 106th Cong. (2000).
Anton’s Law, 114 STAT. 1800 Public Law 107-318, 107th Cong. (2002).
Ye, T. J., and Pickrell, T. M. (2008, April). Child Restraint Use in 2007 – Overall Results,
(Report No. DOT HS 810 931). Washington, DC: National Highway Traffic Safety
Administration.

39
Appendix: Definitions and Categories in NSUBS
In the survey, an occupant is considered to be “restrained” if the occupant meets any of the
following five definitions:
Rear-Facing Car Seat - The child occupant is in a seat that sits on top of the vehicle seat in such a
way that the child faces the rear of the vehicle, and the harness straps are across the child’s front.
The harness straps might be secured or not.
Forward-Facing Car Seat – The child occupant is in a seat that sits on top of the vehicle seat in
such a way that the occupant faces the front of the vehicle, and with harness straps that are across
the child’s front.
High-Backed Booster Seat - The child occupant is in a seat with a seat back that sits on top of the
vehicle seat, and has a seat belt across the front of the child’s body, whether lap or lap/shoulder.
No harness is in use.
Backless Booster Seat - The child occupant is sitting on a platform with no seat back that sits on
top of the vehicle seat, and has a seat belt across the front of the child’s body, whether lap or
lap/shoulder. No harness is in use.
Seat Belt – The occupant is sitting on the vehicle seat and the seat belt is across front of the body
(includes lap belts).
Unrestrained – All other cases.
Although the NSUBS collects children’s individual ages, heights, and weights, we combine these
results into categories in order to produce reliable estimates.
Age categories
The NSUBS uses the following age categories: birth to 12 months, 1 to 3 years old, 4 to 7, 8 to
12, 13 to 15, 16 to 24, 25 to 69, and 70 and older. The choice of these age groups is motivated
by consistency with the NOPUS survey, which uses the age groups birth to 12 months, 1 to 3
years old, 4 to 7, 8 to 12, 13 to 15, 16 to 24, 25 to 69, and 70 and older, combined with taking
into account that the NSUBS collects interview data on children from birth to12 years old.
Height and weight categories
The NSUBS uses the following height categories: under 36 inches tall, 37 to 53 inches, 54 to 56
inches, and 57 inches or taller. The survey uses the weight categories 0 to 19 pounds, 20 to 40
pounds, 41 to 60 pounds, and 61 pounds or heavier. These categories were chosen because they
are used in NHTSA’s old recommendations for the choice of restraint use for children.

40
Regional categories
The 16 PSUs selected in the NSUBS constitute a probability sample of PSUs (counties and
groups thereof) in the United States. The data is not sufficient to produce State-by-State results.
However NSUBS can and does produce regional estimates using the following categories.
Northeast: ME, VT, NH, MA, RI, CT, NY, PA, NJ
Midwest: MI, OH, IN, IL, WI, MN, IA, MO, KS, NE, SD, ND
South: WV, MD, DE, VA, KY, TN, NC, SC, GA, FL, AL, MS, AR, LA, OK, TX, DC
West: AK, WA, OR, CA, NV, ID, UT, AZ, NM, CO, WY, MT, HI
These definitions of the four NSUBS regions are the same regional definitions used in the
NOPUS survey. The NSUBS regional categories were chosen to be the same as the NOPUS
categories for the purpose of consistency.
Race and ethnicity categories
Please consult Section 4 “Demographic Results” for the classifications of race and ethnicity in
NSUB.
DOT HS 811 718
April 2013
9375-040213-v5
