
Charter School Performance in
New York City
October 2017

2
© 2017 CREDO
Center for Research on Education Outcomes
Stanford University
Stanford, CA
http://credo.stanford.edu
CREDO, the Center for Research on Education Outcomes at Stanford University, was established to
improve empirical evidence about education reform and student performance at the primary and
secondary levels. CREDO at Stanford University supports education organizations and policymakers in
using reliable research and program evaluation to assess the performance of education initiatives.
CREDO’s valuable insight helps educators and policymakers strengthen their focus on the results from
innovative programs, curricula, policies and accountability practices.
Acknowledgements
CREDO gratefully acknowledges the support of New York State Education Department (NYSED) who
contributed data support and assistance to this partnership. Our data access partnerships form the
foundation of CREDO's work, without which studies like this would be impossible. We strive daily to
justify the confidence placed in us.
The views expressed herein do not necessarily represent the positions or policies of the organizations
noted above. No official endorsement of any product, commodity, service or enterprise mentioned in
this publication is intended or should be inferred. The analysis and conclusions contained herein are
exclusively those of the authors, are not endorsed by any of CREDO’s supporting organizations, their
governing boards, or the state governments, state education departments or school districts that
participated in this study. The conclusions of this research do not necessarily reflect the opinions or
official position of the New York Education Agency, or the State of New York.

3
Table of Contents
Introduction ................................................................................................................................................. 7
Study Approach ............................................................................................................................................ 8
New York City Charter School Demographics ........................................................................................... 12
Overall Charter School Impact .................................................................................................................. 15
Charter School Impact for the 2011-2015 Cohort ..................................................................................... 17
Charter School Impact by Growth Period ................................................................................................. 18
Charter School Impact by School Level .................................................................................................... 18
Charter School Impact by Students’ Years of Enrollment ........................................................................ 20
Charter School Impact by Race/Ethnicity ................................................................................................. 22
Charter School Impact with Students in Poverty ..................................................................................... 27
Charter School Impact with Race/Ethnicity and Poverty ......................................................................... 29
Charter School Impact with Special Education Students ........................................................................ 32
Charter School Impact with English Language Learners ......................................................................... 33
School–level Analysis ................................................................................................................................. 36
Impact of Charter Management Organizations ........................................................................................ 40
Impact of Charter School Networks .......................................................................................................... 45
New York City High School Graduation Rate ............................................................................................ 47
Synthesis and Conclusions ........................................................................................................................ 49
Implications ................................................................................................................................................ 51
Technical Appendix .................................................................................................................................... 55
Table of Contents

4
Figure 1: CREDO Virtual Control Record Methodology ............................................................... 10
Figure 2: Opened and Closed Charter Campuses, 2011 to 2015 ................................................... 12
Figure 3: Average Learning Gains in New York City Charter Schools Compared to Gains for VCR
Students .............................................................................................................................. 15
Figure 4: Comparison of 2013 and 2017 New York City Study ..................................................... 17
Figure 5: Impact by Growth Period, 2013-2016 ......................................................................... 18
Figure 6: Impact by School Level ............................................................................................. 19
Figure 7: Impact by Students’ Years of Enrollment .................................................................... 20
Figure 8: Learning Gains of Black Students Benchmarked Against Learning Gains of White TPS
Students .............................................................................................................................. 23
Figure 8a: Relative Learning Gains for Black Charter School Students Benchmarked Against their
Black TPS Peers .................................................................................................................. 234
Figure 9: Learning Gains of Hispanic Students Benchmarked Against Learning Gains of White TPS
Students .............................................................................................................................. 25
Figure 9a: Relative Learning Gains for Hispanic Charter School Students Benchmarked Against their
Hispanic TPS Peers .............................................................................................................. 256
Figure 10: Learning Gains of Students in Poverty Benchmarked Against Learning Gains of TPS
Students not in Poverty ......................................................................................................... 27
Figure 11: Learning Gains of Black Students in Poverty Benchmarked Against Learning Gains of
White TPS Students not in Poverty .......................................................................................... 29
Figure 11a: Relative Learning Gains for Black Charter School Students in Poverty Benchmarked
Against their Black TPS Peers in Poverty ............................................................................. 3029
Figure 12: Learning Gains of Hispanic Students in Poverty Benchmarked Against Learning Gains of
White TPS Students not in Poverty .......................................................................................... 31
Table of Figures

5
Figure 12a: Relative Learning Gains for Hispanic Charter School Students in Poverty Benchmarked
Against their Hispanic TPS Peers in Poverty ........................................................................... 312
Figure 13: Learning Gains of Special Education Students Benchmarked Against Learning Gains of
TPS Students not in Special Education .................................................................................... 33
Figure 14: Learning Gains of ELL Students Benchmarked Against Learning Gains of Non-ELL TPS
Students .............................................................................................................................. 34
Figure 15: Average Student Learning Gains of CMO Charter Schools and Non-CMO Charter Schools
Benchmarked Against the Statewide Average TPS Student Learning Gains ................................. 41
Figure 15a: Relative Student Learning Gains of CMO Charter Schools Benchmarked Against Learning
Gains of Non-CMO Charter Schools ........................................................................................ 411
Figure 16: CMO and Non-CMO Student Learning Gains by School Level Benchmarked Against TPS
Learning Gains by School Level .............................................................................................. 43
Figure 16a: Relative Learning Gains of Students in CMOs by School-Level Benchmarked against
Learning Gains of Non-CMO Charter School Students by School Level ....................................... 433
Figure 17: New York City High School Graduation Rate (Cohorts 2009 to 2012) ............................ 47
Figure 18: Overall NYC Schools versus NYC Charters: Regents and Advanced High School Graduation
Rates (Cohorts 2010 to 2012) .................................................................................................. 48

6
Table 1: Demographic Comparison of Students in TPS, Feeders and Charters (School Year 2015-16) . 13
Table 2: Demographic Composition of Charter Students in the Study ........................................... 14
Table 3: Transformation of Average Learning Gains in Reading and Math ...................................... 16
Table 4: Performance of Charter Schools Compared to Their Local Schools in New York City ........... 36
Table 5: Reading Growth and Achievement ............................................................................... 38
Table 6: Math Growth and Achievement .................................................................................... 39
Table 7: Performance of Charter School Networks in New York City based on Growth Effect Size ...... 46
Table 8: Summary of Statistically Significant Findings for New York Charter School Students .......... 52
Table of Tables

7
Introduction
New York City has been the nexus of public discourse about charter schools for nearly two decades.
Charter school advocates praise the sector as providing important parental choice through the
introduction of different educational models of instruction. Opponents contend that their existence is
antithetical to the traditions of public education and produce at least as much harm as good. Despite
the voluminous attention to the topic, only a fraction of that debate is grounded in well researched
evidence about charter schools’ impact on student outcomes. This report contributes to the discussion
by providing evidence for charter students’ performance in New York City over five years of schooling,
beginning with the 2011-2012 school year and ending in 2015-2016.
The current study was supported by the Achelis-Bodman Foundation and the Walton Family
Foundation. With the cooperation of the New York State Education Department (NYSED), CREDO
obtained the historical sets of student-level administrative records. The support of NYSED staff was
critical to CREDO's understanding of the character and quality of the data we received. However, the
entirety of interactions with the Department dealt with technical issues related to the data. CREDO has
developed the findings and conclusions presented here independently.
This report provides an in-depth examination of the results for charter schools in New York City. This
current report has two main benefits. First, it provides a rigorous and independent view of the
performance of the city’s charter schools. Second, the study design is consistent with CREDO’s reports
on charter school performance in other locations, making the results amenable to benchmarking both
nationally and in other locations.
The analysis is presented here in three parts. We first present findings about the effects of charter
schools on student academic performance. These results are expressed in terms of the academic
progress that a typical charter school student in New York City would realize from a year of enrollment
in a charter school. To help the non-technical reader grasp the findings, we translate the scientific
estimates into estimated days of learning based on the foundation of a 180-day school year.
The second set of findings is presented at the school level. Both legislation and public policy operate to
influence school level decisions. These findings look at the performance of students by school and
present school average results.

8
The third set of analyses examines the performance of charter schools grouped by charter school
networks. In New York City, as in the rest of the nation, charter schools networks are comprised of either
charter management organizations, education management organizations, or a combination of both.
These analyses aim to discern whether there are differences between schools that are part of these
charter networks versus charter schools that are independent.
The results of our analysis show that there is overall improvement in the performance of New York City
charter schools. Compared to the educational gains that charter students might have had in a
traditional public school (TPS), the analysis shows that in a year's time, on average, charter school
students in New York City show stronger growth in both reading and math. The impact is statistically
significant: thinking of a 180-day school year as "one year of learning", an average New York City charter
student demonstrates growth equivalent to completing 23 additional days of learning in reading and
63 additional days in math each year. When the findings are disaggregated to examine student sub-
groups, the analysis reveals that several subgroups exhibit stronger growth than their TPS peers while
others do not. Notable growth occurs among Hispanic and Black charter students in poverty, who post
stronger growth compared to their counterparts in TPS, during the period of the study. Overall, over
the four growth periods of the study, charter students demonstrate positive growth in both subjects
with the exception of reading in the 2014-2015 growth period. At the final period of the study, there is
statistically significant growth in both reading and math.
Study Approach
This study of charter schools in New York City focuses on the academic progress (growth) of enrolled
and tested students in New York City charter schools. Whatever else charter schools may provide their
students, their contributions to their students’ readiness for secondary education, high school
graduation, and post-secondary life remains of paramount importance. Indeed, if charter schools do
not succeed in forging strong academic futures for their students, it is unclear whether social and
emotional skills can compensate. Furthermore, current data limitations prevent the inclusion of non-
academic outcomes in this analysis.
This city-wide analysis uses the Virtual Control Record (VCR) methodology that has been used in
previous CREDO publications.
1,2,3
The approach is a quasi-experimental study design with matched
student records that are followed over time. The current analysis examines whether students in charter
1
Cremata, Edward, D. Davis, K. Dickey, K. Lawyer, Y. Negassi, M. Raymond and J.Woodworth. National Charter
School Study 2013 (2013). http://credo.stanford.edu.
2
CREDO Urban Charter School Study (2015).
http://urbancharters.stanford.edu/download/Urban%20Charter%20School%20Study%20Report%20on%2041
%20Regions.pdf
3
Woodworth, James, K. Chirbas, M. Gonzalez, Y. Negassi, M. Raymond W. Snow, and C. VanDonge. Online Charter
School Study (2015). https://credo.stanford.edu/pdfs/Online%20Charter%20Study%20Final.pdf.

9
schools in New York City outperform their traditional public school (TPS) counterparts. This general
question is then extended to consider whether the observed charter school performance is consistent
when the charter school population is disaggregated along a number of dimensions, such as
race/ethnicity and years enrolled in a charter school. Answers to these questions require that we ensure
that the contribution of both the charter schools and the traditional public schools – is isolated from
other potentially confounding influences. Accordingly, these analyses include many other variables
whose purpose is to prevent the tainting of the estimate of charter schooling by other effects. The
analysis includes controls for student characteristics: prior academic achievement, race/ethnicity,
special education status, lunch program participation, English proficiency, grade level, and retention
in grade.
To create a reliable comparison group for our study, we strive to build a VCR for each charter school
student. A VCR is a synthesis of the actual academic experiences of students who are identical to the
charter school students, except for the fact that the VCR students attend a TPS that each charter
school’s students would have attended if not enrolled in their charter school. We refer to the VCR as a
‘virtual twin’ because it consolidates the experience of multiple ‘twins’ into a single synthesis of their
academic performance. This synthesized record is then used as the counterfactual condition to the
charter school student’s performance.
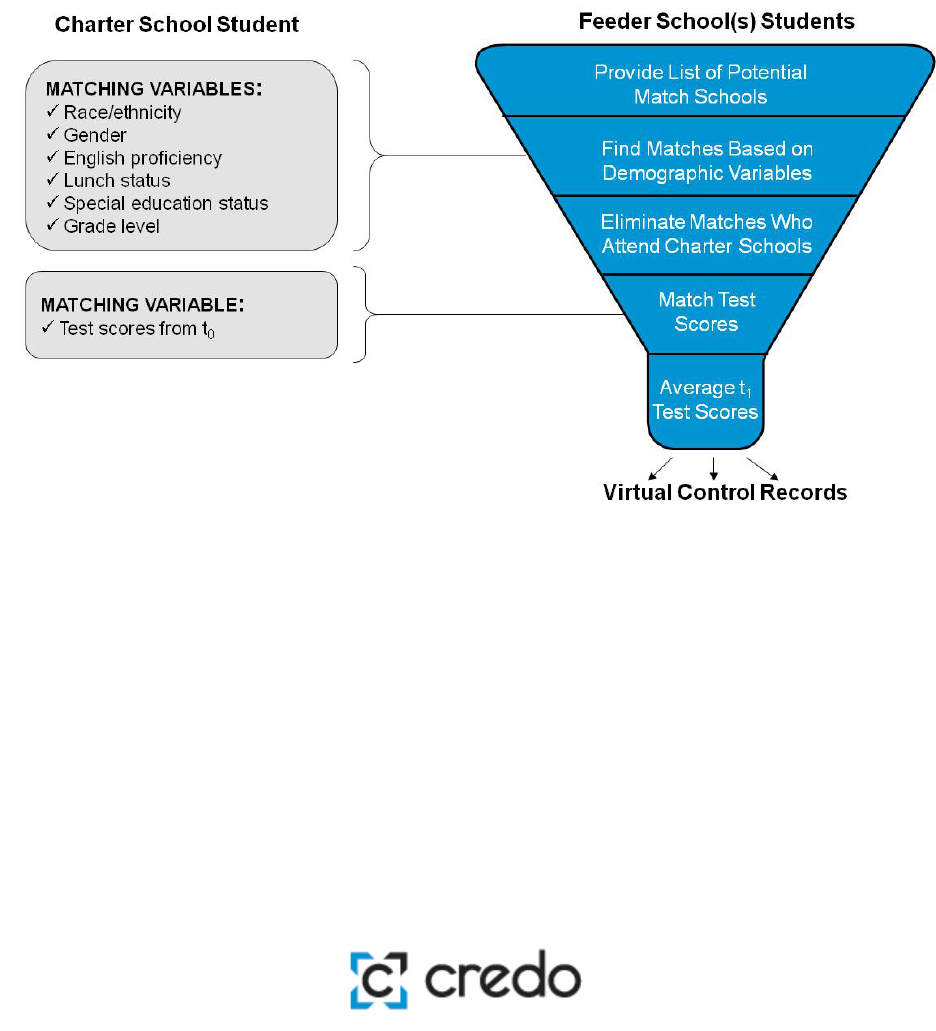
Our approach is displayed in Figure 1. We identify all the traditional public schools whose students
transfer to a given charter school; each of these schools is designated as a “feeder school.” Once a TPS
qualifies as a feeder school for a particular charter school, all the students in the school become
potential matches for a student in that particular charter school. All the student records from all the
feeder schools are pooled – this becomes the source of records for creating the virtual match. Using the
records of the students in those schools in the year prior to the test year of interest (t
0
), CREDO selects
all of the available TPS students that match each charter school student.
Match factors include:
• Grade level
• Gender
• Race/Ethnicity
• Free or Reduced Price Lunch Status
• English Language Learner Status
• Special Education Status
• Prior test score on New York state achievement tests
10
Figure 1: CREDO Virtual Control Record Methodology
At the point of selection as a VCR-eligible TPS student, all candidates are identical to the individual
charter school student on all observable characteristics, including prior academic achievement. The
focus then moves to the subsequent year, t
1
. The scores from this test year of interest (t
1
) for as many
as seven VCR-eligible TPS students are then averaged and a Virtual Control Record is produced. The
VCR produces a score for the test year of interest that corresponds to the expected result a charter
student would have realized had he or she attended one of the traditional public schools that would
have enrolled the charter school's students. The VCR thus provides the counterfactual "control"
experience for this analysis.
For the purposes of this report, the impact of charter schools on student academic performance is
estimated in terms of academic growth from one school year to the next. This increment of academic
progress is referred to by policy makers and researchers as a “growth score” or “learning gains” or “gain

11
scores.” Using statistical methods, it is possible to isolate the contributions of schools from other social
or programmatic influences on a student's growth. Thus, all the findings that follow are reported as the
average one-year growth of charter school students relative to their VCR-based comparisons.
With five years of student records in this study, we create four periods of academic growth. Each growth
period needs a "starting score", (i.e., the achievement test score from the spring of one year) and a
"subsequent score" (i.e., the test score from the following spring) to create the growth measure. To
simplify the presentation of results, each growth period is referred to by the year in which the second
spring test score is obtained. For example, the growth period denoted "2013" covers academic growth
that occurred between the end of the 2011-2012 school year and the end of the 2012-2013 school year.
Similarly, the growth period denoted "2016" corresponds to the year of growth between the 2014-2015
and 2015-2016 school years.
With five years of data, and six tested grades (3rd – 8th) as well as three end-of-course exams in math
(EOCs), there are over 40 different sets of data each for Reading and Math. Each subject-grade-year
group of scores (or, in the case of EOCs, subject-year group) has slightly different mid-point averages
and distributions. Test scores for all these separate tests are transformed to a common scale. All test
scores have been converted to "bell curve" standardized scores to allow year-to-year computations of
growth.
4
When scores are thus standardized into z-scores, every student is placed relative to his own peers in
New York City. A student scoring in the 50
th
percentile in New York City receives a z-score of zero, while
a z-score one standard deviation above that equates to the 84th percentile. Students who maintain
their relative place from year to year would have a growth score of zero, while students who make larger
gains relative to their peers will have positive growth scores. Conversely, students who make smaller
academic gains than their peers will have negative growth scores in that year. In this study it was
possible to create virtual matches for 79 percent of the tested charter school observations in reading
and 77 percent in math.
4
For each subject-grade-year set of scores, scores are centered around a standardized midpoint of zero, which
corresponds to the actual average score of the test before transformation. Then each score of the original test is
recast as a measure of deviation around that new score of zero, so that scores that fall below the original
average score are expressed as negative numbers and those that are larger receive positive values. These new
values are assigned such that in every subject-grade-year test, 68 percent of the original test scores fall within a
given distance, known as the standard deviation.

12
New York City Charter School Demographics
The collection of New York City charter schools has grown markedly since its inception in 1995. Figure
2 below notes the newly opened, continuing, and closed charter school campuses from the Fall of 2011
(the Fall of the first potential growth period for the current study) to the Fall of 2015 (the Fall of the last
potential growth period for the current study)
5
. According to the National Center for Education
Statistics (NCES), there were 231 charter schools open in New York City in the 2015-16 school year.
Figure 2: Opened and Closed Charter Campuses, 2011 to 2015
Because charter schools are able to choose their location, the aggregate demographics of the charter
schools may not mirror that of the NYC district schools as a whole. Further, charter schools may offer
different academic programs or alternate school models, which may disproportionately attract
particular groups of students relative to NYC district schools. In addition, parents and students who
choose to attend charter schools select schools for a variety of reasons, such as location, school safety,
small school size, academic focus, or special interest programs. The cumulative result of all these forces
is that the student populations at charters and their NYC district schools feeders may differ. Table 1
5
“Opened schools” opened as new schools in the fall of the displayed year. “Continuing schools” were opened
prior to the fall of the displayed year and remain open into the next school year (i.e. a school listed as continuing
in the 2015-16 column opened some time prior to 2015-16 and did not close in 2015-16) “Closed schools” cease
operation by the spring of the displayed year (i.e. a school listed as closed in the 2015-16 column had its last
year of operation in 2015-16 and closed at the end of that school year)
13
25
35
17
18
127
139
163
196
213
1
1
1
2
0
0
50
100
150
200
250
300
2011-12 2012-13 2013-14 2014-15 2015-16
# Opened
Continuing
# Closed

13
below compares the student populations in the 2015-2016 school year across three groups: all New
York City’s traditional public schools, those district schools that comprise the set of charter feeder
schools, and NYC charter schools in the aggregate. Table 1 includes the 197 charter schools in which
students took reading and/or math assessments during the 2015-16 school year. Note that NCES (cited
above) reports 231 charter schools open in New York City in 2015-16. The number of charter schools
listed in Table 1 is smaller than the NCES numbers because it excludes schools in which students were
not tested.
Table 1:
Demographic Comparison of Students in District, Feeders and Charters (School Year 2015-16)
The data from Table 1 show that the demographic profile of charter schools is quite different from that
of the public school population in New York City as
a whole. As shown in Table 1, the demographics
for the feeder schools more closely mirror the
district population than the population of
students in charters in New York City. The charter
school population in New York City differs from
both the New York City district and feeder
populations on several demographic variables.
Charter schools have more Black students and
fewer white, Hispanic and Asian/Pacific Islander
students than the public school population. The
proportion of Black students and students in
poverty enrolled in charter schools is noticeably
larger than in traditional public schools. Charters
and feeders both serve slightly more students in
poverty than TPS.
District
Feeders Charters
Number of schools 1637
1032 197
Average enrollment per school 586 618
427
Total number of students enrolled
958,726
637,706 84,179
Students in Poverty
72% 76% 76%
English Language Learners 14% 15%
6%
Special Education Students 21% 20% 17%
White Students 15%
13% 4%
Black Students
25% 28% 56%
Hispanic Students 41% 45%
36%
Asian/Pacific Islander Students 17% 12% 2%
Native American Students 1% 1% 1%
Graphics Roadmap
The graphics in this report have a common format.
Each graph presents the average performance of charter students
relative to their pertinent comparison student
. The reference
group differs depending on the specific comparison. Where a
graph compares student subgroup performance, the pertinent
comparison student is the same for both subgroups. Each graph is
labeled with the pertinent comparison group for clarity.
The height
of the bars in each graph reflects the magnitude of
difference between traditional public school and charter school
performance over the period studied.
Stars are used to reflect the level of statistical significance of the
differen
ce between the group represented in the bar and its
comparison group of similar students in TPS; the absence of stars
means that the schooling effect is not statistically different from
zero.

14
Policymakers and stakeholders focus on the degree to which underserved populations enroll in charter
schools. As shown in Table 1, 20 percent of feeder school students and 21 percent of NYC district
students have special education needs respectively. In contrast, 17 percent of the New York City charter
school population has a designated special education status. Similarly, a lower proportion of New York
City’s charter school population is designated as English language learners than the feeder schools or
district schools as a whole.
Table 2:
Demographic Composition of Charter Students in the Study
For this analysis, a total of 74,918 unique charter school students from 197 charter schools (141,322
observations across four growth periods) are followed for as many years as data are available.
6
The
students are drawn from grades 3 – 8, since these are the continuous grades covered by the New York
State achievement testing program for reading and math or by the state end-of-course assessments.
High school students are included for reading and math whenever they take the end-of-course
assessment sequence in consecutive years, e.g., Algebra I followed by Geometry or Algebra II in the next
year. An identical number of virtual comparison records are included in the analysis in each subject. In
New York City, it was possible to create virtual matches for 77 percent of the tested charter observations
in math and 79 percent in reading. This proportion assures that the results reported here can be
considered indicative of the overall performance of charter schools in New York City. The total number
of observations is large enough to have confidence that the tests of effect can detect real differences
between charter school and TPS student performance at the statistically acceptable standard of p<.05.
Each student subgroup examined also had an acceptable number of observations, as reported in Table
2. Additional descriptive demographics can be found in the Appendix.
6
Schools that opened recently or that only recently begun serving tested grades will not have four growth
periods of experience to include; however, these schools are still included in the analysis for the years in which
data are available
Number Percent Number Percent
New York City Charter Students 74,918 53,175
% Matched 53,175 71%
Black Students 41,889 56% 29,603 56%
Hispanic Students 27,765 37% 20,439 38%
White Students 2,502 3% 1,655 3%
Students in Poverty 57,267 76% 41,946 79%
Special Education Students 13,857 18% 8,074 15%
English Language Learners 3,162 4% 1,895 4%
Grade Repeating Students 4,943 7% 968 2%
Student Group
All Charter Students Tested
Matched Charter Students

15
Overall Charter School Impact
The first question is whether charter schools differ overall from traditional public schools in how much
their students learn, holding other factors constant. We average the pooled performance for all charter
school students across all four growth periods and compare this pooled performance with the same
pooled performance of the VCR students. Figure 3 displays the result, which is a measure of the typical
learning of charter school students in one year compared to their VCR peers from the feeder schools.
On average, students in charter schools in New York City learned more than students in TPS (the VCR
students) in both reading and math.
Figure 3: Average Learning Gains in New York City Charter Schools Compared to Gains for VCR Students
To obtain rigorous estimates, student growth data is analyzed in standard deviation units so that the
results can be assessed for statistical differences. Unfortunately, these units do not have much meaning
for the average reader. Transforming the results into more accessible terms is challenging and can be
done only with a number of general assumptions. Table 3 below, presents a translation of standard
deviation units to Days of Learning, but extreme values should be viewed with caution.
7
7
Hanushek, Eric A. P.E. Peterson, & L. Woessmann. Achievement Growth: International and U.S. State Trends In
Student Performance. Education Next, (2012) Vol. 12, 1–35.
.04**
.11**
-57
-29
0
29
57
86
-.10
-.05
.00
.05
.10
.15
Days of Learning
Growth (in standard deviations)
* Significant at p < 0.05 ** Significant at p < 0.01
Reading
Math

16
Table 3: Transformation of Average Learning Gains in Reading and Math
In order to understand “days of learning,” for a student whose academic achievement is at the 50
th
percentile in one grade and also at the 50
th
percentile in the following grade the next year, the progress
from one year to the next equals the average learning gain for a typical student between the two grades.
That growth is fixed as 180 days of effective learning based on the typical 180-day school year.
We then translate the standard deviations of growth from our models based on that 180-day average
year of learning, so that students with positive effect sizes have additional growth more than the
expected 180 days of academic progress in a year’s time and those with negative effect sizes have fewer
days of academic progress in that same 180-day period of time.
Using the results from Figure 3 and the transformations from Table 3 we can see that in a typical school
year, charter students in New York City exceed the growth of their TPS counterparts in reading and
math. This advantage for charter students is equivalent to 23 more days of learning in a 180-day school
year in reading and 63 days in math.
Growth
(in standard
deviations)
Gain
(in days of math
learning)
0.00 0
0.05 29
0.10 57
0.15
86
0.20 114
0.25 143
0.30 171
0.35
200

17
Charter School Impact for the 2011-2015 Cohort
This section compares the results for New York City charter schools in the current study with earlier
results.
8
In 2013, CREDO released a study of New York City overall charter impact. The results of the
2013 CREDO study are displayed in the left column of Figure 4 and cover the 2005-2006 to 2010-2011
school years. The overall charter school impact found in this 2017 report is displayed in the right column
of Figure 4, covering the 2011-2012 to 2015-2016 school years.
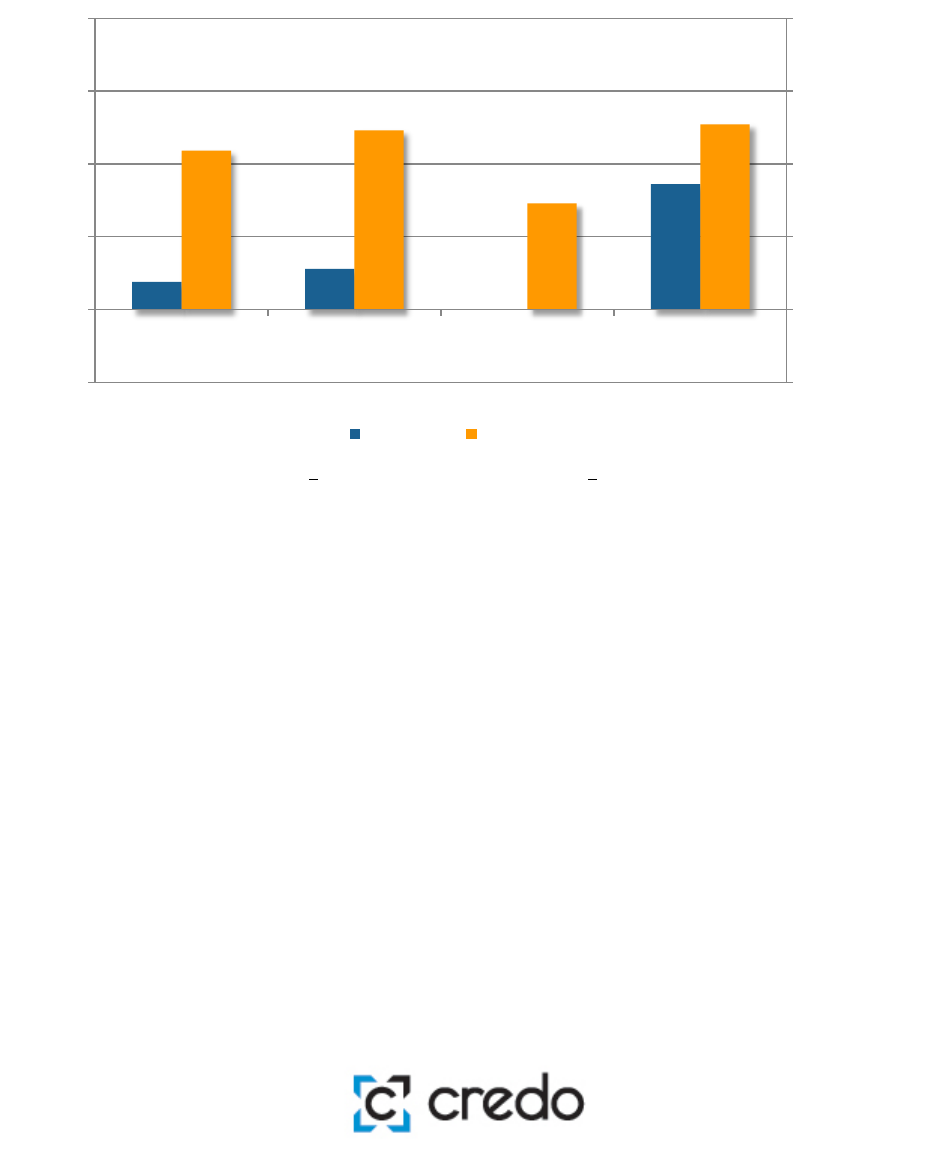
Figure 4 shows that New York City charter schools have experienced slightly higher academic growth in
reading since the 2013 report. In math, charter school students’ academic growth fell since the 2013
study but remains strongly positive. These results translate to an annual gain of 6 more days of learning
in reading and 17 fewer days of learning per annum in math compared to the prior study results.
Figure 4: Comparison of 2013 and 2017 New York City Study
8
CREDO (2013). Charter School Performance in New York City. http://credo.stanford.edu.
.03**
.04**
.14**
.11**
-29
0
29
57
86
114
-.05
.00
.05
.10
.15
.20
Overall New York City 2013
Study
Overall New York City 2017
Study
Days of Learning
Growth (in standard deviations)
* Significant at p < 0.05 ** Significant at p < 0.01
Reading Math
18
Charter School Impact by Growth Period
To determine whether performance remained consistent over all the periods of this study, the average
charter school effects were disaggregated into the four growth periods. Results are shown in Figure 5.
Figure 5: Impact by Growth Period, 2013-2016
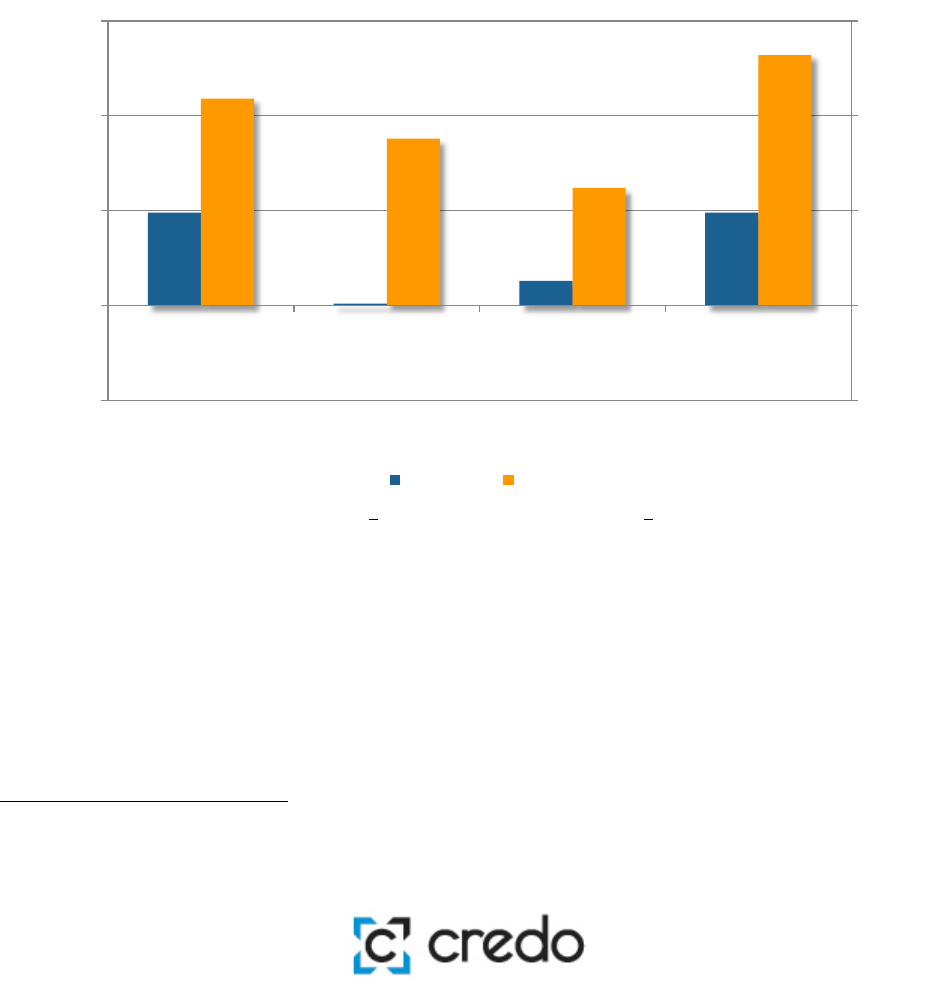
The results depicted in Figure 5 suggest that there were significant gains in learning across the growth
periods for charter school students compared to their TPS peers in math. In reading, charter students
learned similarly to their peers in 2012-2013 and 2014-2015 growth periods; but out-performed TPS
peers in 2013-14 and 2015-16. The 2015-2016 growth period illustrates that charter students
experienced reading growth of approximately 51 more days of learning and 74 days of additional
learning in math compared to their TPS peers. In the 2015-16 growth period charter students see their
largest gains in both reading and math.
Charter School Impact by School Level
.02
.03* .00
.09**
.11**
.12**
.07**
.13**
-29
0
29
57
86
114
-.05
.00
.05
.10
.15
.20
2012-2013
2013-2014
2014-2015
2015-2016
Days of Learning
Growth (in standard deviations)
*Significant at p
< 0.05
** Significant at p
< 0.01
Reading Math
19
Charter schools are permitted to choose which grade levels to serve. Some charter operators focus on
particular ages, some seek to serve a full range of grades, and others build by adding one additional
grade each year. For example, multi-level charter schools serve grade ranges larger than traditional
elementary, middle or high schools. Such a configuration might contain a combination of middle and
high school grades. In New York City, schools are classified as multi-level if they serve both elementary
and secondary students. The National Center for Education Statistics identifies these schools. This
allows us to disaggregate charter school impacts for different grade spans
9
.
This study examines the outcomes of students enrolled in elementary, middle, high, and multi-level
schools. The results appear in Figure 6 below.
Figure 6: Impact by School Level
The results indicate that the strongest charter school performance is observed in elementary and multi-
level schools, where, on average, charter school students see stronger growth than their TPS
counterparts in reading and math. This growth translates to 29 extra days of learning in reading, for
both elementary and multi-level schools. In math, the growth translates to 63 additional days of
9
CREDO does not assign school levels, but rather retains school levels that are assigned to schools by the National
Center for Education Statistics. The sole exception is that CREDO considers a school to be a high school if the
lowest grade served is ninth grade or above.
.05**
.00
0.01
.05**
.11**
.09**
.06
.13**
-29
0
29
57
86
-.05
.00
.05
.10
.15
Elementary Middle High Multi-level
Days of Learning
Growth (in standard deviations)
* Significant at p < 0.05 ** Significant at p < 0.01
Reading Math

20
learning for elementary students and about 74 additional days of learning in multi-level schools.
Charter students in middle school show stronger growth in math than their TPS counterparts
translating to an additional 51 days of learning. Middle school charter students’ reading growth
remains similar to their TPS peers. High school charter students and high school TPS students exhibit
similar growth in both subjects.
Charter School Impact by Students’ Years of Enrollment
Academic growth in charter schools may change depending on how many years a student is enrolled in
a charter school. In order to test this, we group students by the number of consecutive years they were
enrolled in charter schools. In this scenario, the analysis is limited to the charter students who enroll
for the first time in a charter school between the 2011-12 and 2014-15 school years. Although this
approach reduces the number of students included, it ensures an accurate measure of the years of
enrollment. For this reason, the results of this analysis contain a subset of the full study sample and
should not be directly compared with other findings in this report. This question examines whether the
academic success of students who enroll in a charter school changes as they continue their enrollment
in a charter school. The results are shown below in Figure 7.
Figure 7: Impact by Students’ Years of Enrollment

21
The results in Figure 7 above suggest that New York City charter school students in their first year in
charter school show a lower growth in reading compared to their TPS peers. During their first year of
charter enrollment, charter students experience about 63 days of learning gains in math. The second
year sees an increase in charter student growth, as charter students demonstrate 46 additional days
of learning in reading and 103 additional days of learning in math. The third year does not continue
this upward trend but remains positive and significant compared to the TPS comparison group for
both subjects. The learning gains for charter school students in their third year of enrollment translate
to 29 additional days of learning in reading and 86 days in math compared to TPS peers. Charter
school students in their fourth year of enrollment outperform their TPS virtual peers in both reading
and math. This translates to 68 days of additional learning in reading and 97 more days in math. Note
that due to the data window used in this study the number of charter school students enrolled for
three or four years is smaller than for one or two years, since only new students in the first years of the
study would be enrolled long enough to be included. The magnitude of impact and the level of
statistical significance is therefore worthy of note.
-.05**
.08**
.05**
.12**
.11**
.18**
.15**
.17**
-57
-28.5
0
28.5
57
85.5
114
-.10
-.05
.00
.05
.10
.15
.20
First Year Second Year Third Year Fourth Year
Days of Learning
Growth (in standard deviations)
* Significant at p < 0.05
** Significant at p < 0.01
Reading Math

22
Charter School Impact by Race/Ethnicity
Attention to achievement differences of students of various racial and ethnic backgrounds (also known
as student subgroups) has increased since the federal government’s passage of the No Child Left Behind
Act in 2001. The effectiveness of charter schools across ethnic and racial groups is especially important
given the proportion of charter schools focused on educating historically underserved students. The
impact of charter schools on the academic gains of Black and Hispanic students is presented in Figures
8 through 9a below.
The graphs display two distinct comparisons, described below:
1. The first comparison displays the growth of TPS students and charter students in the particular
subgroup of interest relative to the growth of the "average White TPS student," represented by
the 0.00 line on the graph. In this comparison, the White student is male and does not qualify
for subsidized school meals, special education services or English language learner support and
has not repeating his current grade. Both sets of bars reveal the difference in average
performance between the student in the subgroup of interest and the White TPS comparison
student. The stars indicate the level of statistical significance. Thus, if there are no stars, we
interpret the difference in learning gains as similar to the white TPS comparison because we
cannot determine if the observed differences are due to being a member of the subpopulation
or are due to chance. If there is no difference in the learning gains, the bar would be missing
entirely; if the learning of the student group in question is not as great as the comparison
baseline, the bar is negative; and if the learning gains exceed the comparison, the bar is
positive.
2. Graphs labeled “a” display the results of a second comparison testing whether the learning
gains in the charter school student subgroup differ significantly from their VCRs in the same
student subgroup. As with the first graph, stars denote statistical significance.

23
Figure 8: Learning Gains of Black Students Benchmarked Against Learning Gains of White TPS Students
As seen in Figure 8, in New York City, both Black charter schools students and Black TPS students have
significantly weaker academic growth in both reading and math when compared to the average White
TPS student. Black TPS students exhibit 114 fewer days of learning in reading and 137 fewer days of
learning in math. Black charter school students exhibit 91 fewer days of learning in reading and 80 fewer
days of learning in math compared to the average White TPS student. Figure 8a displays the differences
in learning between Black students enrolled in TPS and Black students enrolled charter schools.
-.20**
-.16**
-0.24**
-0.14*
-143
-114
-86
-57
-29
0
29
57
-.25
-.20
-.15
-.10
-.05
.00
.05
.10
Black Students in TPS Black Students in Charter
Days of Learning
Growth (in standard deviations)
* Significant at p < 0.05 ** Significant at p < 0.01
Reading Math

24
Figure 8a: Relative Learning Gains for Black Charter School Students Benchmarked Against their Black TPS
Peers
In New York City, Black charter students experience greater annual progress compared to their TPS
peers in both reading and math. The difference translates to 23 additional days of learning in reading
and 57 days in math. Since Black students account for roughly 56 percent of the charter school
population in this study, these findings explain a substantial portion of the overall performance of
charter schools in New York City.
.04**
.10**
-29
0
29
57
86
-.05
.00
.05
.10
.15
Days of Learning
Growth (in standard deviations)
* Significant at p < 0.05 ** Significant at p < 0.01
Reading Math

25
Figure 9
: Learning Gains of Hispanic Students Benchmarked Against Learning Gains of White TPS Students
In New York City, Hispanic students in both Charter schools and TPS have weaker learning gains in both
reading and math compared to the average White TPS student. Compared to White TPS students,
Hispanic TPS students experience 103 fewer days of learning in reading and 114 fewer days in math.
Hispanic students in charter schools experience 74 fewer days of learning in reading and 51 fewer days
of learning in math compared to White TPS students.
Figure 9a displays the relative differences in learning between Hispanic students enrolled in TPS and
Hispanic students enrolled in charter schools. In New York City overall, Hispanic students in charter
schools perform significantly better in both subjects than Hispanic students attending traditional
public schools. Hispanic charter students experience the equivalent of 29 and 57 more days of learning
in reading and math, respectively, when compared to Hispanic students attending TPS. These findings
have considerable weight in the overall performance of charter schools as a whole, as Hispanic students
make up more than 36 percent of this study’s charter school population.
-.18**
-.13**
-.20**
-.09**
-143
-114
-86
-57
-29
0
29
-.25
-.20
-.15
-.10
-.05
.00
.05
Hispanic Students in TPS Hispanic Students in Charter
Days of Learning
Growth (in standard deviations)
* Significant at p < 0.05 ** Significant at p
< 0.01
Reading Math

26
Figure 9a: Relative Learning Gains for Hispanic Charter School Students Benchmarked Against their Hispanic TPS
Peers
To briefly summarize, the race/ethnicity analyses in this report echo a familiar story: Black and
Hispanic students in both school settings perform worse than the average White TPS student in both
reading and math. Comparing the performance of the same student group across settings shows that
Black charter students outperform Black TPS students in reading and math. Similarly, Hispanic charter
students outperform Hispanic TPS students in both reading and math. Thus, for Black and Hispanic
students, the analysis indicates a significant academic advantage from charter school enrollment.
.05**
.10**
-29
0
29
57
86
-.05
.00
.05
.10
.15
Days of Learning
Growth (in standard deviations)
* Significant at p < 0.05 ** Significant at p < 0.01
Reading Math

27
Charter School Impact with Students in Poverty
Many charter operators expressly aim to improve educational outcomes for traditionally underserved
students, especially for students in poverty. CREDO’s 2013 National Charter Study found that students
in poverty comprise 53% of the national charter population
10
. In New York City, the proportion of
students in poverty is larger; 76 percent of charter students are eligible for subsidized school meals, a
proxy for low income households, as are 72 percent of TPS students. This makes the performance of
students in poverty even more germane in the local discussion of school quality.
Figure 10
: Learning Gains of Students in Poverty Benchmarked against Learning Gains of TPS Students not in
Poverty
Figure 10 above presents the academic growth for students in poverty. In this graph, the baseline is a
typical TPS student who is not eligible for free or reduced price school meals.
11
The performance of the
average non-poverty TPS student has been transformed to zero; the performance of poverty students
10
Cremata, Edward, D. Davis, K. Dickey, K. Lawyer, Y. Negassi, M. Raymond and J.Woodworth. National Charter
School Study 2013 (2013). https://credo.stanford.edu/documents/NCSS%202013%20Final%20Draft.pdf
11
Free and Reduced Price Lunch (FRL) is a standard indicator of poverty. Although we acknowledge that FRL is
not as sensitive as we desire, FRL is currently our best proxy for poverty.
-.03**
.01
-.03**
.10**
-86
-57
-29
0
29
57
86
-.15
-.10
-.05
.00
.05
.10
.15
TPS Students in Poverty Charter Students in Poverty
Days of Learning
Growth (in standard deviations)
* Significant at p < 0.05 ** Significant at p < 0.01
Reading Math

28
are displayed in relative terms. The analysis focuses on the relationship between poverty sector and
academic progress, holding all other factors constant. This leaves a picture of the difference in the
impact of charter attendance on students in poverty compared to similar students who are not in
poverty. The bars on the left hand side represent a TPS student in poverty, showing they perform
significantly lower than their non-poverty peers.
Charter students in poverty outperform their non-poverty peers in TPS in math and are on par in
reading. Both results are noteworthy. Not only are charter school students in poverty outpacing their
poverty peers in TPS to a significant degree in both reading and math, they also have progress that
closes the learning gap with their more affluent peers.

29
Charter School Impact with Race/Ethnicity and Poverty
The most academically needy students in public education are those who are both living in poverty and
a member of a racial or ethnic minority that has been historically underserved. These students face
multiple challenges, and their case has long been the focus of attention. Within the national charter
school community, this group receives special attention from many educators whose efforts are
specifically focused on addressing these students’ needs. The impact of New York City charter schools
on the academic gains of Black students living in poverty is presented in Figures 11 and 11a. Similarly,
Figures 12 and 12a present the impact of charter schools on Hispanic students living in poverty.
Figure 11
: Learning Gains of Black Students in Poverty Benchmarked against Learning Gains of White TPS
Students not in Poverty
In this analysis, the comparison TPS student is neither minority nor in poverty. As shown in Figure 11,
Black students living in poverty, regardless of whether they are enrolled in TPS or charters, make less
progress than the comparison TPS White students who are not in poverty. In New York City, Black TPS
students in poverty have approximately 148 fewer days of learning in reading and 171 fewer days of
learning in math than White non-poverty TPS students. Black charter students in poverty have 125
fewer days of learning in reading and 97 fewer in math than White non-poverty TPS students.
-.26**
-.22**
-.30**
-.17**
-200
-171
-143
-114
-86
-57
-29
0
29
-.35
-.30
-.25
-.20
-.15
-.10
-.05
.00
.05
Black TPS students in poverty Black Charter students in poverty
Days of Learning
Growth (in standard deviations)
* Significant at p < 0.05
** Significant at p
< 0.01
Reading
Math

30
Figure 11a: Relative Learning Gains for Black Charter School Students in Poverty Benchmarked Against their
Black TPS Peers in Poverty
Taking the results from the prior graph, we can evaluate the relative impact for Black students in
poverty across the two public school settings. Black charter students living in poverty learn significantly
more per year in both reading and math compared to Black TPS students living in poverty (Figure 11a),
amounting to 23 extra days in reading and 68 extra days of learning in math.
Across both school settings, Hispanic students living in poverty exhibit weaker performance in both
reading and math than non-poverty White TPS students. Figure 12 below shows that Hispanic TPS
students living in poverty experience on average 137 fewer days of learning in reading and 143 fewer
days in math compared to TPS White students who are not living in poverty. Hispanic students in
poverty attending charter schools have, on average, 108 fewer days of learning in reading and 74 fewer
days in math, per year compared to TPS White students not living poverty.
.04**
.12**
-29
0
29
57
86
-.05
.00
.05
.10
.15
Days of Learning
Growth (in standard deviations)
* Significant at p < 0.05 ** Significant at p < 0.01
Reading Math

31
Figure 12: Learning Gains of Hispanic Students in Poverty Benchmarked against Learning Gains of White TPS
Students not in Poverty
Figure 12a below shows the difference between Hispanic students living in poverty who attend charter
schools and Hispanic students living in poverty who attend TPS. In New York City, Hispanic charter
students in poverty experience 29 additional days of reading growth than Hispanic TPS students in
poverty. In math, Hispanic charter students exhibits stronger growth than Hispanic TPS students in
poverty, translating to approximately 68 more days of learning in math.
-.24**
-.19**
-.25**
-.13**
-171
-143
-114
-86
-57
-29
0
29
57
-.30
-.25
-.20
-.15
-.10
-.05
.00
.05
.10
Hispanic TPS students in poverty Hispanic Charter students in poverty
Days of Learning
Growth (in standard deviations)
* Significant at p < 0.05 ** Significant at p < 0.01
Reading Math

32
Figure 12a: Relative Learning Gains for Hispanic Charter School Students in Poverty Benchmarked Against their
Hispanic TPS Peers in Poverty
Adding the variable of poverty to the race/ethnicity analysis produces similar results to the earlier
race/ethnicity analysis. Being a member of a minority group and also in poverty leaves students even
further behind that either minority or poverty alone, showing the compounding effect for students.
Despite the additive effect of these challenges, charter school students have stronger academic gains
than their peers in TPS in both reading and math.
Charter School Impact with Special Education Students
Due to differences in individual needs, comparisons of outcomes of special education students are
difficult, regardless of where they enroll. In the ideal setting, we would restrict the comparison by
Individual Education Program (IEP) designation and only include students who were matched on each
demographic, including IEP designation. That approach however would result in fewer matches, so
pooling of special education students is needed to support a robust analysis. Because we cannot be
certain that the matches link students with similar needs, the forthcoming results should be interpreted
with caution. The demographic profiles in the current study reveal that 17 percent of the charter school
population in New York City has special education needs compared to 21 percent in TPS schools.
.05**
.12**
-29
0
29
57
86
-.05
.00
.05
.10
.15
Days of Learning
Growth (in standard deviations)
* Significant at p < 0.05 ** Significant at p < 0.01
Reading Math

33
Figure 13: Learning Gains of Special Education Students Benchmarked against Learning Gains of TPS Students
not in Special Education
New York City special education students enrolled in both TPS and charter schools have significantly
weaker growth than students in TPS who do not receive special education services. TPS students in
special education programs experience 103 fewer days of learning in reading and 108 fewer days of
learning in math when compared to TPS students not receiving special education services.
Interestingly, these differences are on par with the learning differences for Blacks and Hispanics. The
bars on the right side of Figure 13 show the impact of being a special education student in charter
schools. The results suggest that the full effect of being a special education student in a charter school
is less negative overall than being a special education student in TPS in both reading and math. The
difference between the two school settings is significant for both reading and math.
Charter School Impact with English Language Learners
There is a growing population of students entering the public school system with a primary language
other than English. Their present success in school will greatly influence their success in the world. The
2015 National Assessment of Education Progress (NAEP) documents the gap in performance between
English Language Learners (ELL) and their English proficient peers, with ELL students having weaker
-.18**
-.16**
-.19**
-.11**
-143
-114
-86
-57
-29
0
29
57
86
-.25
-.20
-.15
-.10
-.05
.00
.05
.10
.15
TPS Students in Special Education Charter Students in Special Education
Days of Learning
Growth (in standard deviations)
* Significant at p < 0.05 ** Significant at p < 0.01
Reading Math

34
performance
12
. Our analysis, in both reading and math, align with NAEP results. As shown in Figure 14,
English language learners in TPS schools show significantly weaker growth per year than non-ELL
students, amounting to a gap of 51 days of learning in reading and 38 less days in math.
In Figure 14, the pair of bars on the right represent the average difference between being a charter
student with ELL designation a non-ELL TPS student. Charter students with ELL designation experience
57 fewer days of learning in reading and similar learning in math to their non-ELL TPS counterparts.
When compared to the same baseline, charter ELL students experienced similar growth in reading as
TPS ELL students, the blue bars are similar in size. The difference is not statistically significant.
However, in math charter ELL students have stronger growth than TPS ELL students, and even are on
par with students with no language limitations. The statistically significant difference that math charter
ELL students have compared to the TPS ELL students amounts to roughly 40 more days of growth for
ELL students attending a charter school.
Figure 14: Learning Gains of ELL Students Benchmarked Against Learning Gains of Non-ELL TPS Students
12
The Nation’s Report Card. (2016) 2015 Mathematics and Reading Assessments
http://www.nationsreportcard.gov/reading_math_2015/#mathematics/groups?grade=4
-.09**
-.10**
-.07**
.00
-171
-143
-114
-86
-57
-29
0
29
57
86
-.25
-.20
-.15
-.10
-.05
.00
.05
.10
.15
TPS Students with ELL designation Charter Students with ELL designation
Days of Learning
Growth (in standard deviations)
* Significant at p < 0.05 ** Significant at p < 0.01
Reading Math

35

36
School–level Analysis
In the preceding sections the analyses have highlighted the performance of charter school students in
New York City including the breakdown of subgroups analysis. However, in addition to that, education
policy makers would like to know the school-level academic performances. Similarly, parents and the
public at large want to make informed enrollment decisions based on the schools’ progress in their
communities.
Comparing School-level Quality In order to determine the current distribution of charter school
performance, the average effect of charter schools on student learning over the two most recent growth
periods (2015 and 2016) is compared to the experience that students would have realized in their local
traditional public schools.
13
The educational market consists of VCR students matched with each
student in a given charter school. This analysis provides an average contribution to student learning
gains for each charter school. This measure is called the school’s “effect size”. As with the overall and
by-year impacts, school effect size is expressed in standard deviations of growth.
As noted in Table 1, charter schools are smaller on average than their corresponding feeder schools.
Further, some charter schools elect to open with a single grade and mature one grade at a time.
Consequently, care is needed when making school-level comparisons to ensure that the number of
tested students in a school is sufficient to provide a fair representation of the school’s impact. Our
criteria for inclusion were at least 60 matched charter student records over the two years or at least 30
matched charter records for new schools with only one year of data. Our total sample consists of 144
schools with reading scores and 153 schools with math scores in the 2015 and 2016 growth periods.
Table 4 below shows the breakout of performance for the New York City charter schools that meet our
criteria for inclusion by having a sufficient number of charter student records.
Table 4: Performance of Charter Schools Compared to Their Local Schools in New York City
13
We chose to include only the two most recent growth periods in this analysis because we wanted a highly
relevant contemporary distribution of charter school performance.
Subject Number Percent Number Percent Number Percent
Reading 23 16.0% 59 41.0% 62 43.1%
Math 26 17.0% 54 35.3% 73 47.7%
Significantly
Worse
Not Significant
Significantly Better

37
In reading, 43 percent of charter
schools perform significantly better
than their peer traditional public
schools, while nearly 48 percent
perform significantly better in math.
Each of these results show growth
larger than the national average
(nationally, 25 percent of charter
schools outperform their local
counterparts in reading and 29 percent
do so in math
14
). When looking at
weaker performance, 16 percent of
New York City charter schools have
reading results that are significantly
weaker than the local TPS option,
while 17 percent do so in math
(nationally, 19 percent of charter
schools perform lower than the local
counterparts in reading and 31 percent
do so in math). In reading, 41 percent
of charter schools do not differ
significantly from traditional public
schools in their communities. In math,
35 percent of charter schools have
growth performance that is indistinguishable from TPS in New York City.
Impact of Growth on Achievement While the impacts of charter schools on academic growth relative
to their local competitors is informative, these analyses do not indicate how well students perform in
absolute terms. Since many of the students served by charter schools start at low levels of achievement,
their absolute achievement (in addition to their relative growth) is vital to understanding student
success overall. To do this, each school’s average growth is placed in the context of their school wide
achievement level compared to the rest of the state, as in Tables 5 and 6 below. We use the effect sizes
discussed above to measure growth. The school’s average achievement level is the mean achievement
of the students over the same two periods covered by the effect size analysis (2015 and 2016).
15
The 50
th
percentile indicates statewide average performance for all public school students (traditional and
charter). A school achievement level above the 50
th
percentile indicates that the school's overall
achievement exceeds the statewide average.
14
CREDO (2013). National Charter School Study 2013. http://credo.stanford.edu.
15
Average achievement was computed using students’ z-scores from the end of the growth period (e.g., spring
2014 and spring 2015), and the resulting school-level mean was then converted into a percentile.
A Note about
Tables 5 and 6
There are four quadrants in each table. We have expanded on
the usual quadrant analysis by dividing each quadrant into
four sections. The value in each box is the percentage of
charter schools with the corresponding combination of growth
and achievement. These percentages are generated from the
2015 and 2016 periods.
The uppermost box on the left denotes the percentage of
charters with very low average growth but very high average
achievement. The box in the bottom left corner is for low-
growth, low-achieving schools.
Similarly, the topmost box on the right contains the
percentage of charters with very high average growth and very
high average achievement, while the bottom right corner
contains high-growth, low-achieving schools.
The major quadrants were delineated using national charter
school data. We would expect the majority of schools to have
an effect size between -0.15 and 0.15 standard deviations of
growth (the two middle columns). Similarly, we would expect
about 40% of schools to achieve between the 30
th
and 70
th
percentiles.

38
Table 5: Reading Growth and Achievement
In reading, 88 of the 144 New York City charter schools (61 percent) have positive average growth (this
percentage is the sum of the eight squares in the blue and pink quadrants in the right half of the table).
Thirty nine percent of charters have positive growth and average achievement above the 50
th
percentile
of the state (i.e., the total for the blue quadrant on the top right). Nearly 39 percent of schools post
smaller learning gains than their local peer schools (the sum of gray and brown quadrants on the left
half of the table). About 48 percent of charters perform below the 50
th
percentile of achievement (the
sum of the brown and purple cells in the lower portion of the table). The area of greatest concern is the
26 percent of schools that fall into the lower left quadrant of the table. These schools are characterized
by both low achievement and low growth.
Growth
(in Standard
Deviations)
0.0% 0.7% 1.4% 7.6%
70th Percentile
0.0% 12.5% 18.8% 11.1%
50th Percentile
1.4% 20.1% 18.8% 3.5%
30th Percentile
2.1% 2.1% 0.0% 0.0%
-0.15
0.15
Low Growth,
High Achievement
High Growth,
High Achievement
Low Growth,
Low Achievement
High Growth,
Low Achievement
0

39
Table 6: Math Growth and Achievement
In math, 107 of the 153 New York City charter schools (nearly 70 percent) have positive average growth
in math, as seen in the combined orange and pink quadrants in the right half of the table. Approximately
47 percent of charters have positive growth and average achievement above the 50
th
percentile (the
orange quadrant in the upper right of the table). Approximately 46 percent of charters post
achievement results below the 50
th
percentile of the state for math (the sum of cells in the lower half of
the table); these findings are similar to those presented in Table 5 for reading. In the pink quadrant in
the lower right of the table, 24 percent (36 schools) of the 153 schools classified as having low
achievement have high growth and appear to be on an upward trajectory. As in the previous table, the
schools of greatest concern are those schools in the lower left (brown) quadrant that have both low
achievement and low growth; they account for 23 percent (35 schools) of the charter schools in New
York City.
Growth
(in Standard
Deviations)
0.0% 0.0% 3.9% 9.2%
70th Percentile
0.0% 7.2% 14.4% 19.0%
50th Percentile
1.3% 13.1% 17.0% 6.5%
30th Percentile
7.2% 1.3% 0.0%
0.0%
-0.15
0.15
Low Growth,
High Achievement
High Growth,
High Achievement
Low Growth,
Low Achievement
High Growth,
Low Achievement
0

40
Impact of Charter Management Organizations
Charter Management Organizations (CMOs) are entities that operate multiple schools, sharing common
leadership and practices. We define CMOs by using two criteria: first, CMOs are organizations operating
three or more schools. Second CMOs hold the charters for the schools they operate.
16
CMOs have some
operational advantages in their ability to spread administrative fixed costs over a larger number of
schools or students, thus providing the possibility of greater efficiency (i.e. the cost per student or per
school is lower). In addition, with more schools and students than a single charter school, CMOs may
be able to support additional programs and more robust staffing in their networks. Whether these
organizations lead to better student outcomes is a matter of interest across the United States.
Identifying all the CMOs in New York City and associating them with their schools and students is not
straightforward. This analysis only includes schools located in New York City, even if a CMO also
operates schools in other communities. The CMO analysis includes 66 charter schools from 13 CMOs.
The analysis looks at the comparative performance of charter schools that belong to charter
management organizations (CMOs) and those that do not belong to CMOs. As with the earlier statewide
graphs, each graph in this section displays two distinct comparisons:
1. The first graph compares the performance of charter students enrolled in CMO-affiliated
schools and charter students in independent charter schools to the performance of the
"average statewide student in TPS."
2. The second graph compares the difference in learning between charter students who attend
CMO charter schools and those who attend charters that are not part of CMOs.
Figure 15 illustrates the impact of CMO charter schools and non-CMO charter schools on their students’
math and reading growth. This growth is benchmarked against growth of an average White TPS
student.
16
The New York State Charter Schools act prohibits for-profit firms from applying for a charter.

41
Figure 15: Average Student Learning Gains of CMO Charter Schools and Non-CMO Charter Schools Benchmarked
Against the Statewide Average TPS Student Learning Gains
In both reading and math, New York City students enrolled in a CMO charter exhibit stronger average
growth compared to their TPS peers: they get approximately 46 more days of learning in reading and
97 more days in math. The graph also shows that students enrolled in a charter that is not part of a CMO
perform similarly to their TPS peers in reading but experience 34 days of additional learning in math.
Figure 15a displays the learning difference between students who attend CMO charters and those who
attend non-CMO charters. The figure shows that CMO charter students exhibit stronger growth
translating to approximately 40 more days of learning in reading and 63 more days in math compared
to non-CMO charter students.
.08**
.00
.17**
.06**
-29
0
29
57
86
114
-.05
.00
.05
.10
.15
.20
Charter CMO Charter Non-CMO
Days of Learning
Growth (in standard deviations)
* Significant at p < 0.05 ** Significant at p < 0.01
Reading Math

42
Figure 15a: Relative Student Learning Gains of CMO Charter Schools Benchmarked Against Learning Gains of
Non-CMO Charter Schools
In order to better understand the performance of charter schools associated with CMOs and
independent charter schools, schools were grouped by grade span. Figure 16 shows that charter
elementary school students, both CMO and non-CMO, perform better than students in TPS elementary
schools in both reading and math. CMO elementary students outperform their TPS peers with an
additional 29 days of learning in reading and 74 additional days in math.
In middle school, students enrolled in CMO charters outperform their TPS peers in both reading and
math. The largest gains for middle school CMO charter students across all grade spans are represented
by an additional 125 days of learning in math. Students enrolled in non-CMO charter middle schools
performed similarly to their TPS counterparts in both reading and math. High school students enrolled
in CMO charters experience similar growth to their TPS counterparts in reading but gained 63 additional
days of learning in math. The students in non-CMO charter high schools perform similarly to their TPS
counterparts in both math and reading. The results for students in CMO charter multi-level schools were
dramatic: they exhibit a learning gain of 57 days in reading and 114 days in math compared to their
TPS peers. Students enrolled in multi-level independent charter schools exhibit similar growth to their
TPS peers in both subjects.
.07**
.11**
-57
-29
0
29
57
86
-.10
-.05
.00
.05
.10
.15
Days of Learning
Growth (in standard deviations)
* Significant at p < 0.05 ** Significant at p < 0.01
Reading Math

43
Figure 16: CMO and Non-CMO Student Learning Gains by School Level Benchmarked Against TPS Learning Gains
by School Level
Figure 16a below shows how the two types of charter schools compare to each other; these results
illuminate how CMOs are contributing to student learning relative to independent charter schools. The
figure shows that for students in charter elementary or high schools, there is no benefit to enrolling in
a CMO-affiliated school; none of the comparisons are statistically significant. Middle school students
enrolled in a CMO charter have stronger growth than their non-CMO peers, translating to 74 extra days
of learning in reading and 97 days more in math. Similarly, CMO charter multi-level school students
outperform non-CMO charter schools by a larger margin, gaining approximately 80 extra days of
learning in reading and 97 days more learning gains in math.
.05**
.05**
.10**
-.03
-.02
.07
.10**
-.04
.13**
.09**
.22**
.05
.11*
.01
.20**
.03
-57
-29
0
29
57
86
114
143
-.10
-.05
.00
.05
.10
.15
.20
.25
CMO
Non-CMO CMO Non-CMO
CMO Non-CMO CMO
Non-CMO
Elementary Middle School
High School
Multi-level School
Days of Learning
Growth (in standard deviations)
* Significant at p < 0.05 ** Significant at p < 0.01
Reading Math

44
Figure 16a: Relative Learning Gains of Students in CMOs by School-Level Benchmarked against Learning Gains
of Non-CMO Charter School Students by School Level
Students attending charter schools that belong to CMOs exhibit stronger reading growth than an
average TPS student. Similarly, students attending CMO charter schools have stronger growth
compared to their peers attending non-CMO charter schools in both reading and math. When separated
into school levels, CMO charter students show stronger reading and math growth in elementary, middle
and multi-level schools than an average TPS student. However, for the high school grade span, students
gain additional learning only in math. Students attending non-CMO schools exhibit stronger math and
reading growth in elementary school than an average TPS student. In middle, high and multi-level
schools, these non-CMO charter students exhibit similar growth in both reading and math compared to
the average TPS student.
.01
.13**
-.09
.14**
.04
.17**
.10
.17**
-57
-29
0
29
57
86
114
-.10
-.05
.00
.05
.10
.15
.20
Elementary Middle School
High School Multi-level School
Days of Learning
Growth (in standard deviations)
* Significant at p < 0.05 ** Significant at p < 0.01
Reading Math

45
Impact of Charter School Networks
CREDO defines a charter school network as a single organization which oversees the operations of three
or more charter schools. The two types of charter school networks are charter management
organizations (CMOs) and education management organizations (EMOs). A CMO is an organization
which holds the charter to their schools and operates the schools directly. An EMO is an organization
which operates a charter school on behalf of the party who holds the charter. This study looks at the 16
charter networks in New York City, that encompass 80 charter schools representing about 52 percent
of New York City’s charter student population at the time of this study.
Table 7 includes results of charter schools networks, whether EMOs or CMOs, unless a network has
fewer than three charter schools with tested grades during the course of the study. Networks with fewer
than three schools with tested grades have been removed from Table 7, consistent with CREDO’s policy
of not identifying individual schools.

46
Table 7:
Performance of Charter School Networks in New York City based on Growth Effect Size
Note: Number of students reflect 2015-16 tested enrollment figures
Table 7 displays performance of charter school networks (CMO or EMO) based on their effect size in
reading and math. In reading, students in the top performing network experience approximately 137
extra days of learning and approximately 239 additional days of learning in math. Conversely, students
attending charter schools in the lowest-performing networks exhibit as low as 34 fewer days of learning
in reading. The results for math in the lowest performing networks are not significantly different from
the comparison group.
Network Name
Growth Effect
Size
Days of
Learning
Number of
NYC
Schools
Number
of
Students
Reading
Harlem Success .24** 137 12 1,044
KIPP NYC .14* 80 5 1,800
Achievement First .11** 63 6 2,189
Uncommon NYC .10** 57 12 3,691
Icahn .10** 57 3 133
Democracy .08* 46 5 1,441
Ascend .03 17 3 1,153
Victory .03 17 9 1,140
New Visions -.03 -17 5 116
Heritage/White Hat*
-.04 -23 4 1,259
Explore -.06** -34 4 854
Math
Harlem Success .42** 239 12 628
Icahn .30** 171 3 124
Achievement First .28** 160 6 2,457
Democracy .24** 137 5 1,943
KIPP NYC .24** 137 5 1,987
Uncommon NYC .15** 86 12 3,648
New Visions .11* 63 7 1,517
Ascend .06** 34 3 1,203
Victory .07 40 9 1,257
Heritage/White Hat*
-.01 -6 4 1,246
Explore -.01 -6 4 849
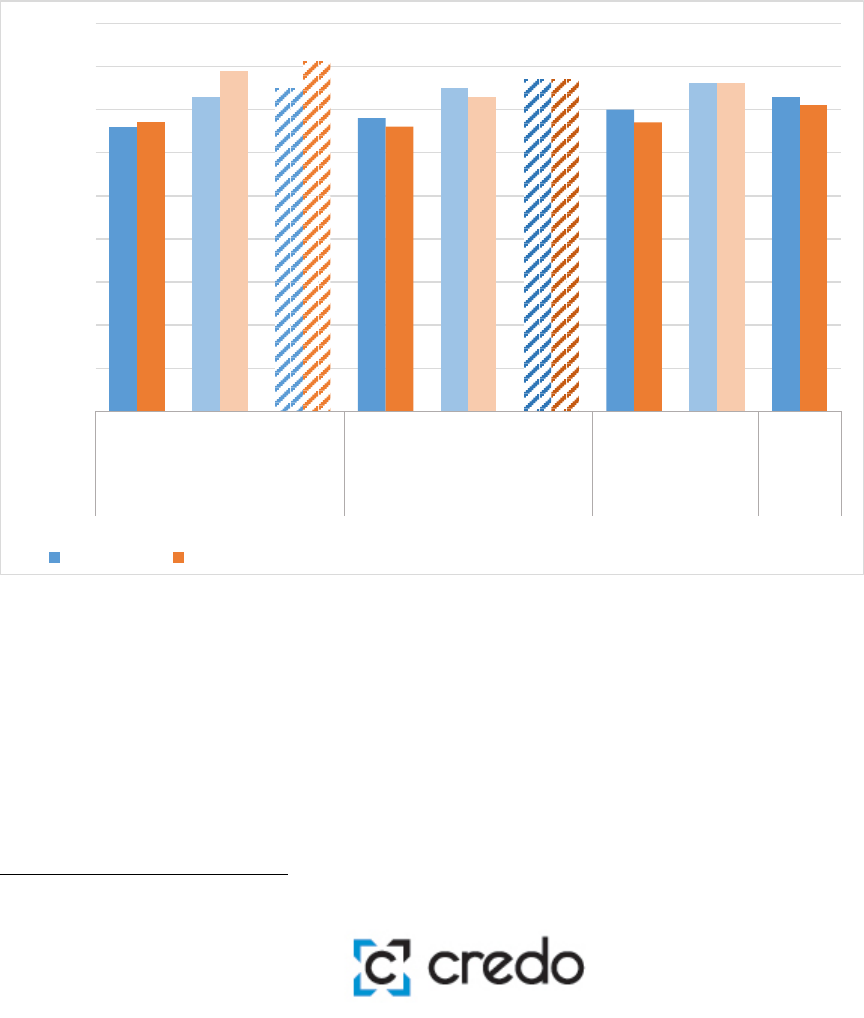
47
New York City High School Graduation Rate
The high school graduation rate is a useful measure that tracks final academic attainment for K-12
students. The NYC high school graduation rate data contains the 4-Year, 5-Year, and 6-Year graduation
rates for New York City public schools. The 4-Year graduation rate reflects percentage of students who
graduated in 4 years after their first time enrollment in 9
th
grade. The 5-Year and 6-Year graduation rates
reflect percentage of students who graduated after five and six years in high school, respectively. The
graduation rates used in this analysis includes the August graduates for each cohort.
17
Figure 17: New York City High School Graduation Rate (Cohorts 2009 to 2012)
Source: http://schools.nyc.gov/Accountability/data/GraduationDropoutReports/default.htm
Statistics for NYC as a whole cover both TPS and charter schools. As shown in Figure 17, New York City
4-Year high school graduation rates (the darker solid blue bars in Figure 17) show a positive trend from
66 percent of the 2009 cohort graduating on time to 73 percent in cohort 2012. The 5-Year (lightly
colored bars) and 6-Year (striped bars) graduation rates follow similar modest gains across the cohorts.
For charter schools the 4-Year high school graduation rate has increased from 67 percent for 2009
cohorts to 71 percent for cohort 2012. New York City charter schools 5-Year graduation rate saw a 6-
17
The 6-year graduation rate is available only for June graduates
66
73
75
68
75
77
70
76
73
67
79
81
66
73
77
67
76
71
0
10
20
30
40
50
60
70
80
90
4-year 5-year
6-year
4-year 5-year 6-year
4-year
5-year 4-year
Cohort 2009 Cohort 2010 Cohort 2011
Cohort
2012
Graduation rate(%)
NYC Overall NYC Charters
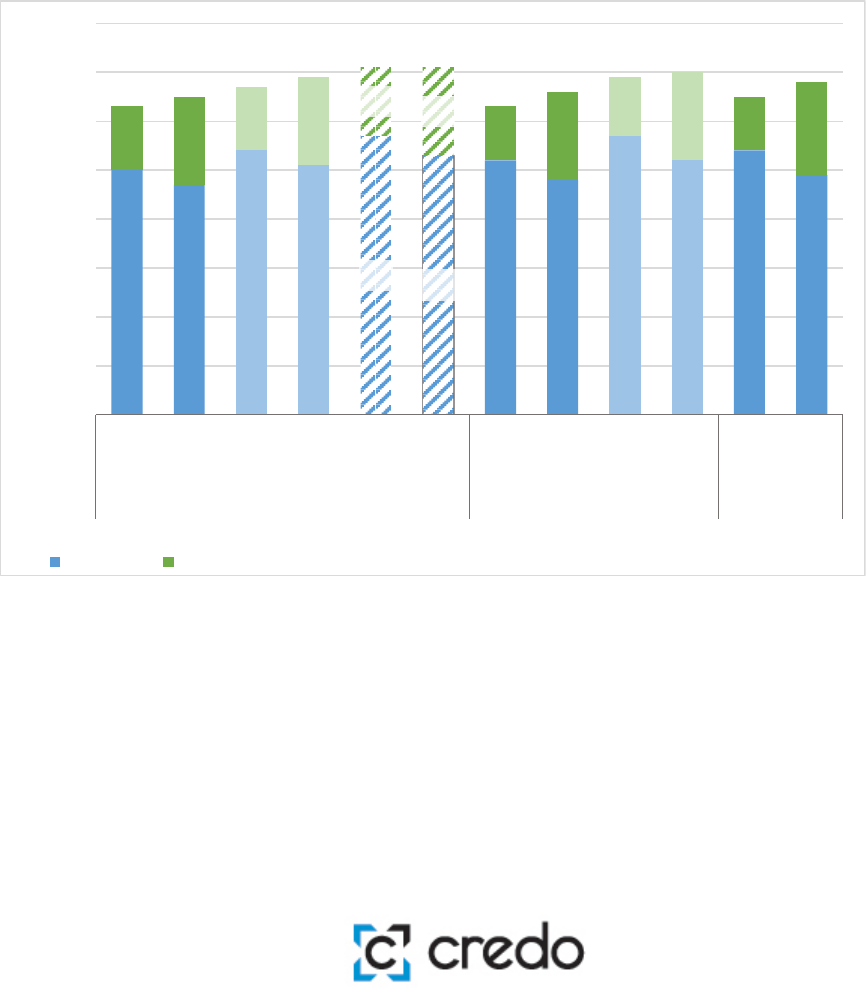
48
percentage point drop from the 2009 to 2010 cohorts but a reversal in the 2011 cohort. Similarly, the 6-
Year graduation rate saw a 4-percentage point decrease across the cohorts we can observe.
While overall graduation figures are informative, New York offers a variety of graduation credentials
which are not equal in stature or rigor. To further probe the preceding analysis, we present the Regents
and Advanced Regents graduation data for cohorts 2010 to 2012 for NYC as a whole and with charter
schools as a separate group. This analysis provides more depth in understanding the high school
graduation rate differences between the NYC overall (TPS and charters) versus NYC students who get a
Regents or Advanced Regents diploma.
Figure 18: Overall NYC Schools versus NYC Charters: Regents and Advanced High School Graduation Rates
(Cohorts 2010 to 2012)
Source: http://schools.nyc.gov/Accountability/data/GraduationDropoutReports/default.htm
Figure 18 shows the graduation rate with any Regents diploma (blue bars) is higher in NYC charter
schools than is for overall NYC (TPS and charter combined). This is true across all periods and cohorts.
However, the percentage of graduates receiving an Advanced Regents diploma (green bars) is lower for
NYC charter schools across all the cohorts.
50
47
54
51
57
53
52
48
57
52
54
49
13
18
13
18
14
18
11
18
12
18
11
19
0
10
20
30
40
50
60
70
80
4-year
charter
4-year
All
5-year
charter
5-year
All
6-year
charter
6-year
All
4-year
charter
4-year
All
5-year
charter
5-year
All
4-year
charter
4-year
All
Cohort 2010 Cohort 2011 Cohort 2012
Graduation Rate (%)
Regents Advanced

49
Synthesis and Conclusions
Over the course of the four growth periods from the 2011-2012 to the 2015-2016 school years, students
in New York City charter schools experienced more learning gains in a year, on average, than their TPS
counterparts. The benefits for charter students amount to 23 days of additional learning in reading and
63 additional days in math. Charter school students learning gains over the four growth periods
demonstrate an upward trend in both subjects.
The results presented in this study cover more recent years of performance than earlier reports. This is
a critical point of understanding, as the numbers of schools, the number of operating grades and the
number of students all shift over time. Our analysis uses academic progress from one year to the next,
in part, to account for these shifts. With our approach, we can estimate the typical one-year progress
of a generic student in charter schools and compare that measure of growth both to a comparison
standard (a virtual twin peer in TPS) and to earlier measures of charter school growth from earlier
studies.
The study showed that the performance in charter schools is not even across all grade spans. New York
City charter elementary, middle and multi-level school students exhibit stronger growth in math
compared to their TPS peers. In reading, only elementary and multi-level school students show
stronger growth than their TPS peers. Charter students in middle school and high schools, however,
experience similar growth in reading compared to their TPS peers. These results imply that charter
elementary and multi-level schools are responsible for a great deal of the increased charter schools
performance in reading.
When the findings were examined by demographic subgroups, they showed stronger growth for
minorities and students in poverty, compared to their peers attending TPS. Black charter students in
poverty have stronger growth relative to Black TPS students in poverty in both reading and math. The
difference translates to an additional 23 days of learning in reading and 68 days of learning in math.
Similarly, Hispanic charter students in poverty exhibited stronger growth than Hispanic TPS student in
poverty. The difference is equivalent to an additional 29days of learning in reading and 68 days of
learning in math. These are noteworthy findings given that Black and Hispanic students make up
approximately 56 and 36 percent of charter students in poverty respectively.
18
Students with special education needs and English language learners also receive significant impact
from charter school attendance. New York City charter schools enroll students with special education
needs and English language learners at lower percentages compared to their TPS counterpart schools.
18
Based on the students in our sample.

50
Special education students in NYC schools have weaker growth compared to their non-special
education classmates in both reading and math regardless of their school setting. However, a charter
student with special education needs has significantly stronger academic gains that her special
education peer in TPS.
Similarly, English language learners show weaker growth than their non-ELL peers in both math and
reading regardless of school type. However, the full effect of being a charter ELL student exhibit much
stronger growth in math compared to TPS ELL students, while it exhibit similar growth in reading.
In New York City, 52 percent of charter schools belong to a network. The students in schools affiliated
with Charter Management Organizations (CMOs) have significantly stronger academic gains compared
to their non-CMO charter counterparts, amounting to 40 more days of learning in reading and 63 more
days in math. Once separated by school grade span configuration (elementary, middle, high, and multi-
level) the analyses reveal that middle and multi-level school students in CMO charters have stronger
growth than their non-CMO charter peers in both reading and math. In elementary and high school,
CMO charter students exhibit similar growth to their peers attending non-CMO charter schools. On
average, New York charter students are getting stronger learning gains from attending a charter school
associated with a CMO.
Analyses of school level impact indicate that the share of New York City charter schools that outpace
TPS in academic learning gains has increased for both subjects. Forty-three percent of New York City
charters now outpace the learning impacts of TPS in reading and 48 percent do so in math. Taking into
account the “moving window of data” discussed earlier, these results display a marked improvement
in reading since the previous CREDO study on New York City Charter School performance.
19
The 2013
CREDO study found only 22 percent of New York City charters outpaced TPS in reading. However, the
math results have declined in this study compared to 63 percent of charter schools outpacing TPS in
math in 2013.
Both student-level and school-level analyses show that charter schools perform well relative to the
local alternatives. The larger question of whether charter schools are helping students achieve at high
levels is also important. Forty-eight percent of charter schools in New York City fall below the 50
th
percentile of New York State’s achievement distribution in reading and 46 percent of charters fall below
the 50
th
percentile of statewide achievement in math. These percentages, though large, still represent
a decrease in the percentage of schools that fall below the 50
th
percentile of achievement since CREDO’s
previous 2013 analysis of New York City charter school performance. In 2013 a total of 60 percent of
New York City charter schools had below-average growth and below-average achievement in reading
and 43 percent in math. The percentage of schools that fall below the 50
th
percentile of achievement in
math was slightly lower than the current study’s finding of 46 percent.
19
CREDO (2013). Charter School Performance in New York City. http://credo.stanford.edu.

51
The underperforming charter schools are partially offset by the proportion of charter schools that are
either already achieving at high levels or are positioned to reach those levels. In New York City, 88
charter schools (61 percent) have positive academic growth in reading and 107 (70 percent) have
positive academic growth in math (not taking achievement into account). In reading, fewer than half of
the schools below the 50
th
percentile of achievement exhibit positive growth. In math, slightly more
than half of the schools that fall below the 50
th
percentile exhibit yearly growth that is better than
average for New York City charter schools.
Analysis of high school graduation rate in NYC indicates that high school graduation rates have
increased across cohorts. The trend is similar whether looking at all NYC high schools or just the subset
of NYC charter high schools. We further looked into the Regents and Advanced Regents for all public
high schools versus NYC charter high schools. The results suggest that NYC charter schools graduation
rate is higher for Regents diploma across all cohorts. However, the Advanced Regents graduation rate
percentages were lower for the charter schools compared to overall NYC public schools Advanced
Regents rates.
Overall, the positive trends found in this study indicate that charter schools in New York City are
providing superior long-term prospects for their students. There remain charter schools whose
performance is insufficient to provide their students with the academic foundations they need for
college, career and life; however, the number and proportion of charter schools with inferior results is
declining.
Implications
The analyses presented in this study have several implications. The current study’s findings continue a
trend of strong positive effects for charter school students that began in our first New York City study in
2010 and has continues through several updates.
1. Enduring strong record of performance – especially among networks. Shows that high quality
education can be realized in the small and at scale, even with students who have not been well
served in the traditional school setting.
2. Persistently strong operators should have both opportunity and obligation – encouraged to
continue to replicate to offer their program to more students and also to show other providers
what they do so others might emulate.
3. The number of underperforming schools is smaller than in earlier studies – a result that
demonstrates the willingness of authorizers to intervene when results call for it. This should
continue. It’s vital in the specific NYC context and serves as a strong exemplar for the nation.

52
4. Deeper analysis is needed to explore the specific practices and program features that lead to
the strong results observed here. Future research should include a wider set of outcome
measures and a broader qualitative inquiry into school operations.
Table 8 on the following page presents a summary of the results from the various analyses in this report.

53
Table 8: Summary of Statistically Significant Findings for New York City Charter School Students
Reading
Math
New York City Charter Students
Positive
Positive
Charters in 2012-2013
Similar
Positive
Charters in 2013-2014
Positive
Positive
Charters in 2014-2015
Similar
Positive
Charters in 2015-2016
Positive
Positive
Elementary School Charter Students Positive
Positive
Middle School Charter Students
Similar
Positive
High School Charter School Students
Similar
Similar
Multi-Level School Charter Students
Positive
Positive
First Year Enrolled in Charter School
Negative
Positive
Second Year Enrolled in Charter School
Positive
Positive
Third Year Enrolled in Charter School
Positive
Positive
Fourth Year Enrolled in Charter School
Positive
Positive
Black Charter School Students
Positive
Positive
Hispanic Charter School Students
Positive Positive
Charter School Students in Poverty Positive
Positive
Black Charter School Students in Poverty Positive
Positive
Hispanic Charter School Students in Poverty
Positive Positive
English Language Learner Charter School Students Similar
Positive
Special Education Charter School Students Positive
Positive
Charter CMO
Positive Positive
Charter Non-CMO
Similar Positive
Charter CMO Elementary Schools
Positive Positive
Charter Non-CMO Elementary Schools Positive
Positive
Charter CMO Middle Schools Positive
Positive
Charter Non-CMO Middle Schools Similar
Similar
Charter CMO High Schools
Similar Positive
Charter Non-CMO High Schools Similar
Similar
Charter CMO Multi-level Schools
Positive Positive
Charter Non-CMO Multi-level Schools Similar Similar

54

55
Technical Appendix
The table below presents the number of charter observations associated with the corresponding results
in the report. An equal number of VCRs were included in each analysis.
Appendix Table 1: Number of Observations for All Results
Student Group
Reading Math
New York City Charter Students 94,808 108,454
Students in Charters in 2011 15,868 18,111
Students in Charters in 2012 22,129 24,933
Students in Charters in 2013 26,605 30,486
Students in Charters in 2014 30,206 34,924
Students in Urban Schools 94,808 108,454
Students in Elementary Schools 42,598 41,501
Students in Middle Schools 22,183 23,465
Students in High Schools 824 8,721
Students in Multi-level Schools 29,203 34,655
Students First Year Enrolled in Charter School 16,773 21,521
Students Second Year Enrolled in Charter School 9,816 11,962
Students Third Year Enrolled in Charter School 5,131 5,551
Students Fourth Year Enrolled in Charter School 1,308 1,511
Black Students 55,326 61,065
Hispanic Students 33,937 41,360
White Students 451 499
Students in Poverty 73,972 85,163
Black Students in Poverty 42,684 47,291
Hispanic Students in Poverty 28,363 34,703
Special Education Students 14,151 15,390
English Language Learners 2,677 3,268
Grade Repeating Students 1,250 1,832
Matched Charter
Students

56
Appendix Table 2: Starting Deciles in New York City Charter Schools
Student Group
Reading Math
Students in Decile 1 4,580 5,078
Students in Decile 2 8,409 8,804
Students in Decile 3 10,678 11,416
Students in Decile 4 12,056 12,609
Students in Decile 5 13,364 14,512
Students in Decile 6 12,209 14,844
Students in Decile 7 12,225 14,156
Students in Decile 8 11,572 13,517
Students in Decile 9 7,076 9,012
Students in Decile 10 2,639 4,506
Matched Charter
Students
